|
Ionel Daniel Stroe
CS 563 March 3rd, 1999 |
|
|
Ionel Daniel Stroe
CS 563 March 3rd, 1999 |
|
The distortion-oriented techniques have become increasely important in the past years. This is mostly because the computer technology permits now to various users to acquire and store large amount of data at a low cost. However, the exploration of such large data is seriously affected by the limited displaying capabilities of the output devices. Therefore, the issue of finding "good" mappings between the data space and the display space is crucial. Defining a "good" mapping (and in general a "good" representation) is not quite simple. Intuitively, it means that the limited data presented to the user should be as relevant as if it were if such a displaying constraint didn't exist. From a functional point of view, three conditions could be distinguished. First (i) the visualization application should provide a tool to locate a desired item in the dataset. Second (ii) data should be represented in such a way that makes its interpretation possible and third (iii) the exploration should always preserve the context. This means that data currently displayed is somehow related with the other data, so that users still have the flavour of the overall information while exploring some parts of it in detail.
The first (i) property states the need of an exploration (navigation) tool. This exploration can be performed without or with distorting the original space of data. In the first case, compromising (ii) and (iii) seems to be difficult. Several techniques were proposed. Some of them reduce the size of the representation by mapping the data points into small graphical constructs (going up to a pixel based representation) -solution that makes the interpretation be difficult (ii)- while others use different paging methods to evenly partition the data -solution that makes data be unrelated with the overall context (iii). On the other hand, a distortion oriented navigation succeeds in balancing the two apparently contradicting requirements. Therefore, although for some applications distorting the space is unacceptable due to the "unnatural" appearance it might generate, distortion-oriented explorations seems to be better approaches.
Generally there are two problems associated with the representation of data in a confined space: a spatial problem and an information density problem. The current presentation aims to explore the first one.
In general, we can define a spatial distortion technique as a technique that alters (distorts) the spatial relationship between the data objects. It creates this way a region of interest which allows the user to examine a local area, while presenting at the same time a global view of the space to provide an overall context to facilitate navigation.
The method has two analogies in the real world. A simple way of visualizing the working of a distortion-oriented presentation technique is to treat the displayed information as if it were printed on a stretchable rubber sheet mounted on a rigid frame (it is necessary that the edges of the sheet be able to slide along the edges of the frame). The rubber is densely populated with information to the extend that in its un-stretched form, the viewer can only see the global context of the data structure and is not able to make out any detailed information from it. In order that a viewer examine a particular section to access detailed information, the rubber sheet has to be stretched. Any stretching of the rubber sheet is analogous to applying magnification to a section of the screen. As the rubber sheet is mounted on a rigid frame, any stretching in one part of the sheet will result in a "shrinkage" with an equivalent amount in other areas.
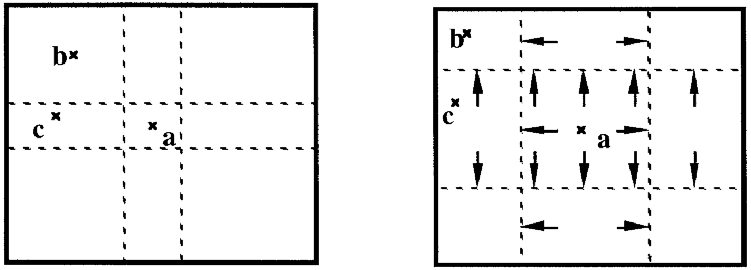
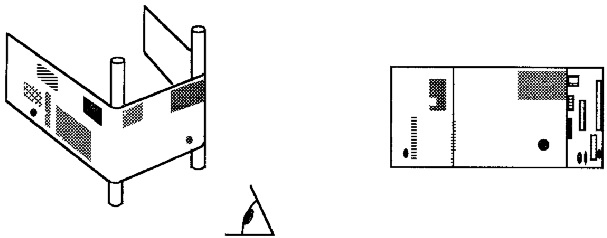
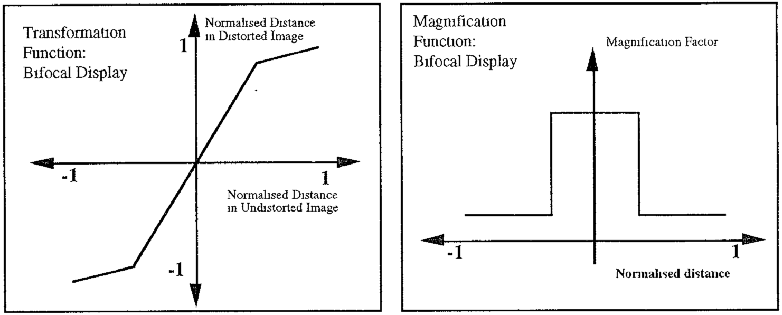
The two different way to model the concept have a common mathematical background. A distorted view is created by applying a mathematical function (called transformation function) to an undistorted image. The transformation function for a presentation techniques defines how the original image is mapped to a distorted view. Moreover, its characteristics determine what class (classification category) that technique falls in. The magnification function is the first derivative of the transformation function. It provides a profile of the magnification (or demagnification) factors associated with the entire area of the undistorted image under consideration.
To place our distortion techniques in the more general framework of the presentation techniques we give the chart below. It illustrates the possible options on how to display graphical and non-graphical data on a space-limited output device.
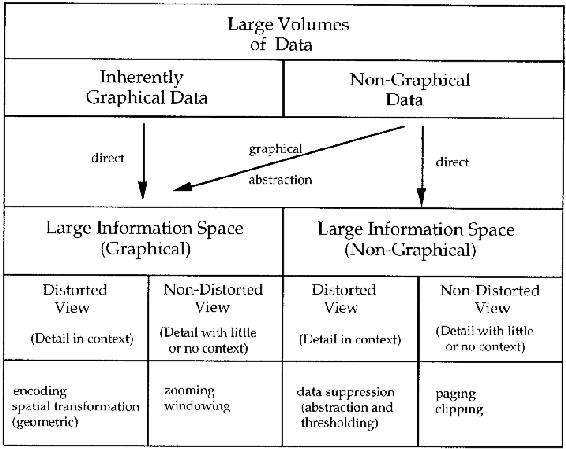
In general, there are some aspects that a spatial distortion based technique has to solve. The way these aspects are addressed and solved determines what type of a technique that particular one is. The first of these aspects refers to whether the focus area is static or dynamic. While a dynamic focus area is highly desirable in most of the cases, there might be techniques that do not support it. The second aspect refers to whether the magnification function is continuous or discontinuous. A discontinuous magnification function determines the resulting image to be "broken", non-smoothly, but is generally simpler and more intuitive. The last aspects refers to the degree a dimension depends on other dimensions. Usually we consider the case of a 2D space where the dimensions are independent one another. These characteristics of the distortion techniques will guide our survey in what follows.
This is probably the most intuitive and easy to implement technique. It has linear transformation functions in both focus and out-of-focus areas (constant magnification factors). The distortion is obviously discontinuous, but the technique provides a natural dynamic focusing. The transformation and the magnification functions are presented below:
The bifocal transformation can be applied in one or two dimensions (see below). When applied in two dimensions, nine regions in the visual are formed. In the central area there is no demagnification. In the left and right areas there is a demagnification in the X dimension, while in the top and bottom areas there is a demagnification in the Y direction. Similarly, the corners are de-magnified in both dimensions. The results of applying this technique on an uniform grid is shown below:

Polyfocal Displays
The polyfocal display is given by a more complex hyperbolic (or polynomial) transformation function as shown below. This function is continuous and can have multiple peaks. It is usually completely described by two parameters. One controls the value in the center of the focus area and the other describes the rate of change of magnification with distance from the point of focus.
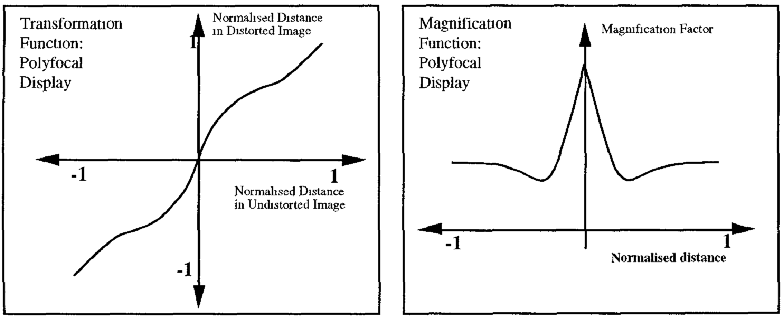
The application of this technique for the same uniform grid in one and two dimensions , with one and multiple peaks is presented below. Note that in case of multiple peaks, their magnification factor may differ.
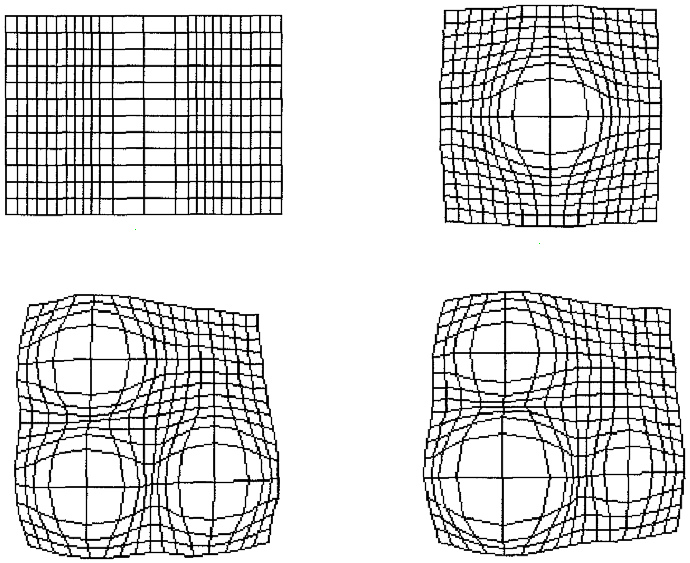
As the example above reveals, the polyfocal transformations distort the boundary of the representation. This unfortunately does not produce a natural appearance when implemented on a rectangular screen. To overcome this problem, several techniques have been proposed. Some of them use further transformations to re-map the result to a rectangular space, while others apply the transformation function independently on each of the dimensions and combine the results using a Cartesian relationship. Examples to illustrate the use of these methods in both cases are provided below. In the left-hand side a boundary distortion transformation is presented. Then, the result of a Cartesian and of a re-mapping approaches are shown in the right-hand side.

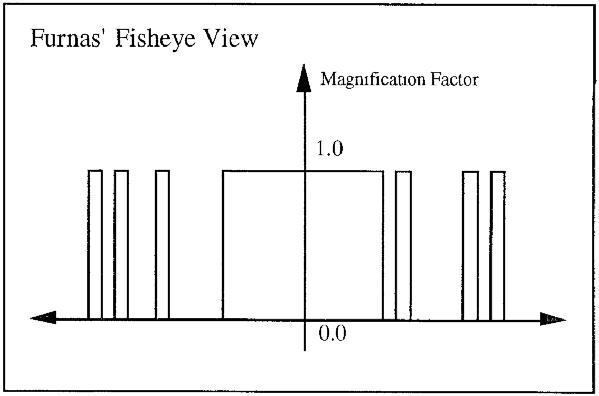
Several methods of distortion, sometimes highly unrelated, are now called fisheye. Initially, the term was introduced by Furnas in 1986 when describing a method to visualize hierarchical data. According to this initial definition, the fisheye views are based on a degree-of-interest function that assign an "importance" value to each data point. This value is computed using both an API (a priori importance) value and the distance value between the focus point and the point being evaluated. Further, a thresholding operation is considered. This way only a limitate selection of data points (which pass the threshold condition) is displayed (see picture below). The method is efficient in finding anomalies in a given dataset, but suffers in that the user may loose the context. Moreover, the method is inherent discontinuous.
Later on, another semantics for fisheye views has been proposed by Mitta[2]. His method is based on a continuous magnification function as shown below. However, his method strongly affects the shape of the boundary. Moreover, it does not have a natural extension for dynamic focusing (the magnification function has to change).
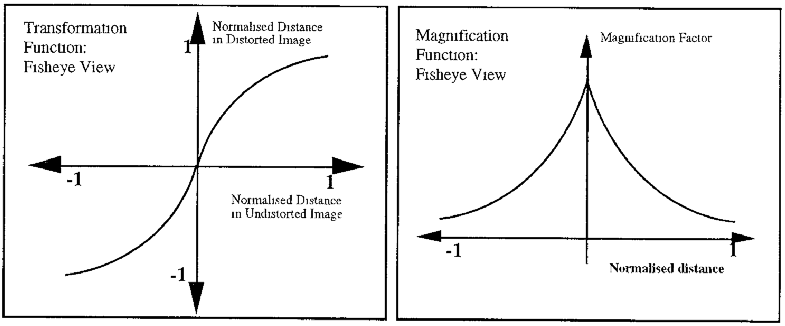
We show again the result of the transformation on our uniform grid, when applying the technique in one or two dimensions.
This method directly implements the physical model presented in Section 2. A central area is displayed at the original resolution while the out-of-view regions are reduce with a factor of cos(a) to simulate the perspective effect. are Conceptually, this method is an extension of the bifocal displays when the out-of-view regions are non-linearly distorted. The method is also discontinuous, by allowing a magnification discontinuity at the boundary between the central area and the two out-of-focus regions. Moreover, like the bifocal transformation it can naturally handle the change of the focus area. Below, we present the transformation and magnification functions for this transformation, as well as its result when applying on an uniform grid.
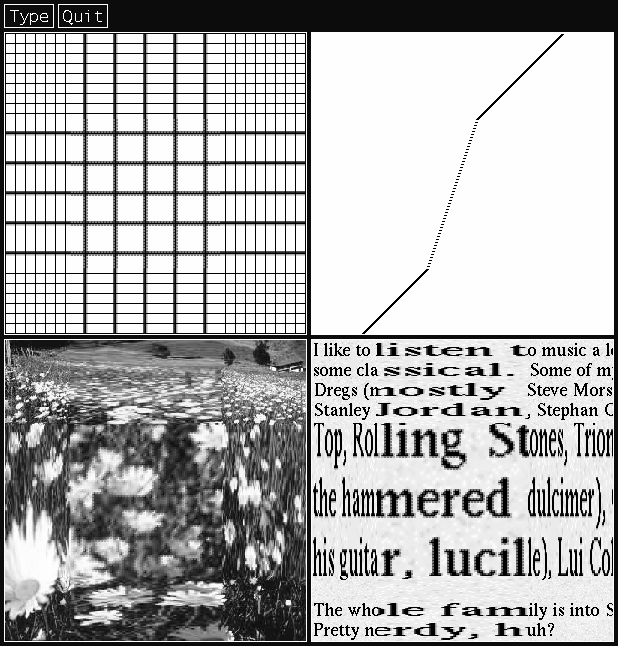
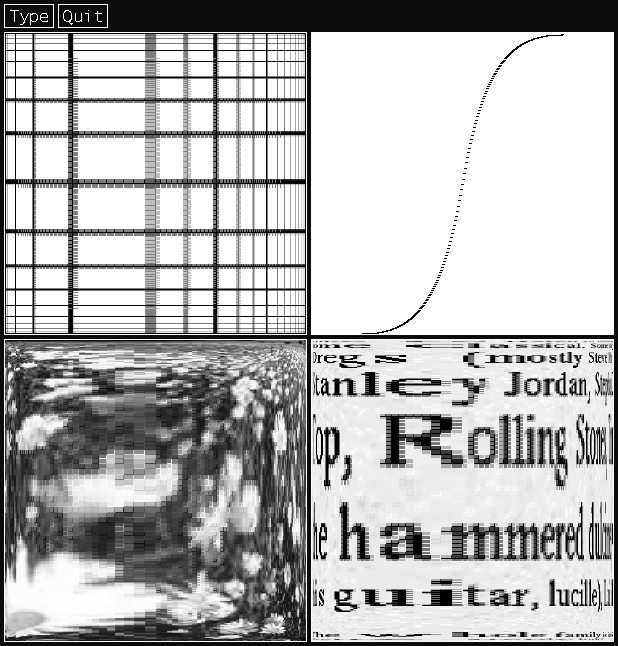
I implemented for this presentation two of the most representative distortion techniques. Both of them allow the user to change the focus area dynamically. Specifically, I considered a bifocal transformation (discontinuous) and a fisheye(2) transformation (continuous) and I applied them both on text data and on graphical data (a photography). The results are presented below.
I wrote both of these algorithms in C using the LIBSX graphical package.
The complete code for this demo can be found here.
As an implementation detail, it is worth to mention that, unlike the
traditional approach in which the data in the focus area is presented undistorted
while a demagnification function reduces the size of the data in the other
regions, I kept the out-of-focus regions undistorted while magnifying the
central area. This approach actually enlarge the data space, in contradiction
somehow with the initial goal. However, a new problem had to be considered
in this case: the one of filling the white spaces now generated in the
central area. In this implementation, a simple interpolation approach was
used.
 |
 |
Some of the figures used in this presentation have been obtained from [1].