The Mendelbrot is probably the most famous of all fractals. Almost everyone has seen this famous image discovered by Mendelbrot in the late 70s.
You have seen the picture, but do you understand it. If you are like most people, then you probably haven't had the time to look into the details behind the picture. So the question that we have to answer is how was it created? The Mendelbrot Set is actually created using a very simple function.
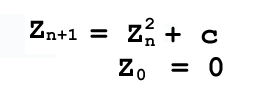
The c in the functin is any constant complex number such as 1 + 2i, etc... The main idea behind this function is the idea of recursion. Recursion is the process of repeating the same thing over and over again. An example of which is recursively calling x^2 starting with 2. You get 2^2 -> 4^2 -> 16^2 and so on. You are able to come up with the picture above using this method of recursion. The picture itself is actually a map that displays for which values of c does recursively calling the function go to infinity. Where ever the function does not go to infinity, that c value is displayed as black. Mendelbrot determined that if the function ever increases to 2 or above it will increase to infinity. So therefore, if any value reaches two it is displayed with a color scheme. This color scheme is based on the iteration that the c value reaches 2. In the image above, the higher the iteration is the close the color gets to red.
The Julian Set uses the same equation as the Mendelbrot Set.
The difference between the two functions is that the c value in the function is a fixed complex number. What changes is X_0. An example X_0 value is r*exp(it). You are able to derive any Julian Set from the Mendelbrot Set. This property is shown below.
A simple way of looking at the Julian Set is that it is the 3D projection of a point in the Mendelbrot Set. If at any point on the Mendelbrot set you project it into the 3rd dimension you will then get the Julian Set for that c value.