|
|
Application
- Financial Data
In this example,
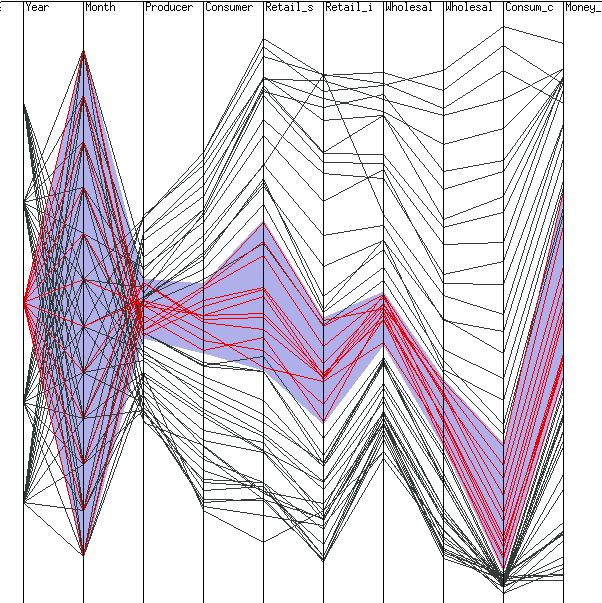
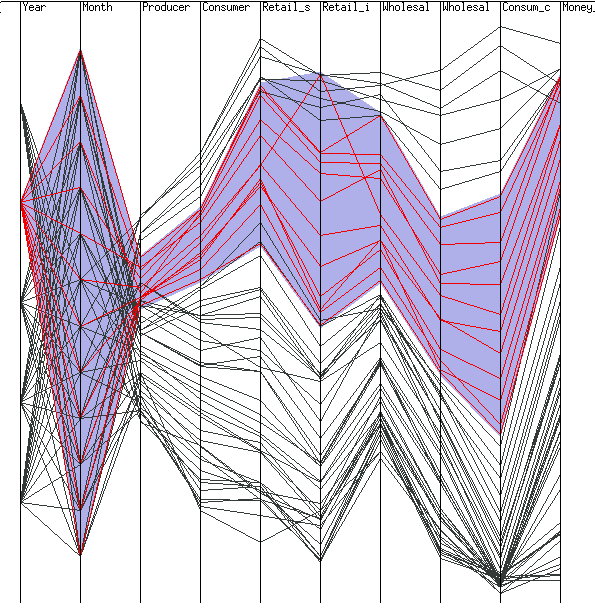
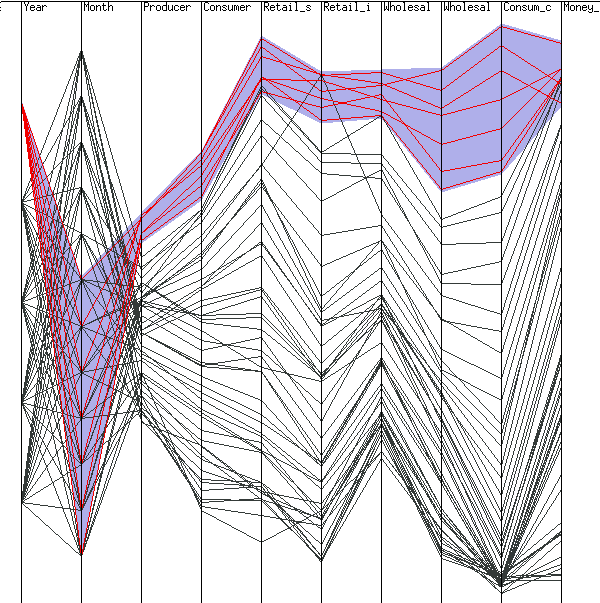
we use 5 years of financial data to examine changes over time.
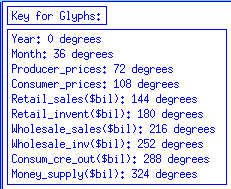
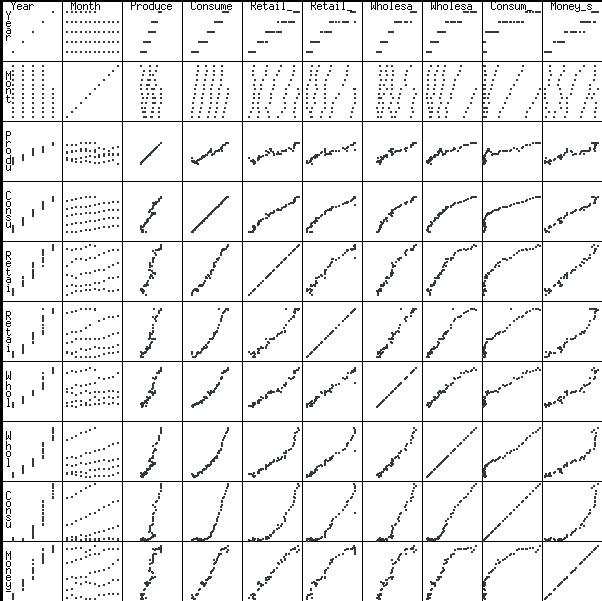
The first figure describes the data dimensions, the second shows
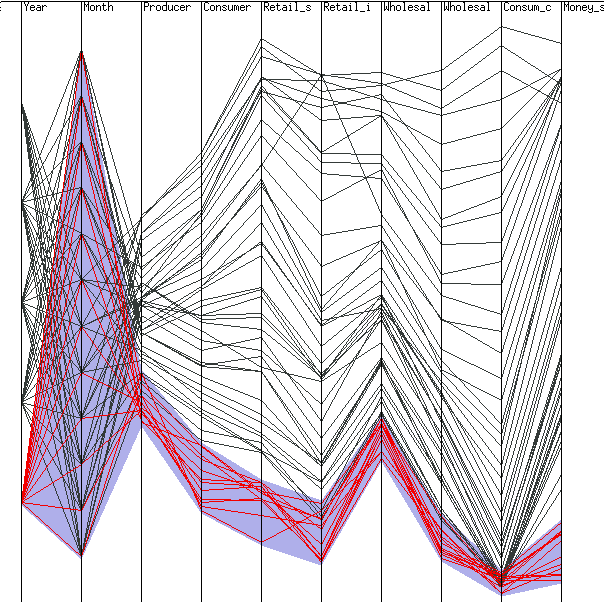
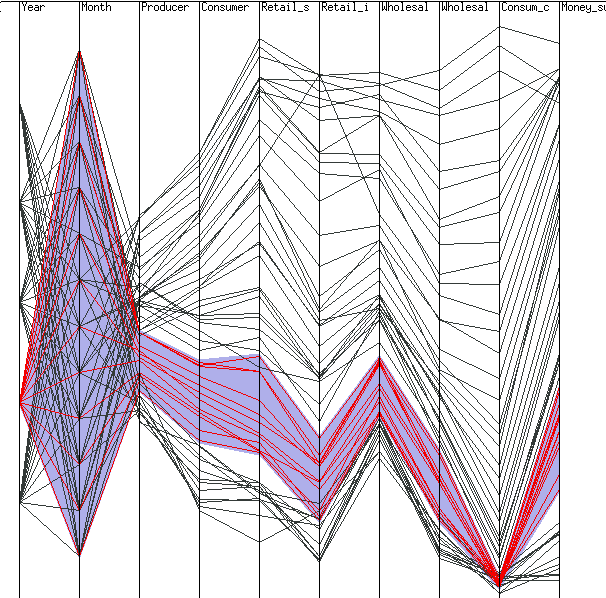
the entire data set using scatterplots, and the rest of the figures
show parallel coordinates views for each year. We can see that
certain years have much more variability than others, and relations
between some of the dimensions become apparent. We could also
brush over months to see seasonal variations.
|