|
|
Managing Discoveries in Visual Analytics
Model Space Visualization for Multivariate Linear Trend Discovery
Zhenyu Guo, Matthew O. Ward, and Elke A. Rundensteiner
Discovering and extracting linear trends and correlations in datasets is very important for analysts to understand multivariate phenomena. However, current widely used multivariate visualization techniques, such as parallel coordinates and scatterplot matrices, fail to reveal and illustrate such linear relationships intuitively, especially when more than 3 variables are involved or multiple trends coexist in the dataset. In this work, we propose a novel multivariate model parameter space visualization system that helps analysts discover single and multiple linear patterns and extract subsets of data that fit a model well. Using this system, analysts are able to explore and navigate in model parameter space, interactively select and tune patterns, and refine the model for accuracy using computational techniques. We build connections between model space and data space visually, allowing analysts to employ their domain knowledge during exploration to better interpret the patterns they discover and their validity.
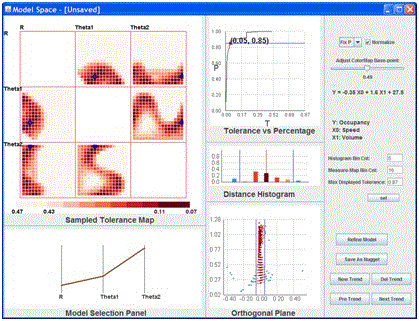
The figure below shows the model space view. The parallel coordinate view (bottom left) is the model selection panel. Users can select and adjust any linear trend pattern in this panel. Each poly-line, representing a single point, describes a linear trend in data space. The sampled tolerance map (top left) indicates where the strong linear models exist (dark areas). The three views in the right shows the distributions of data instances in terms of the linear trend. Users can change the tolerance (trend boundaries) to collect more or less data instances that fit the selected trend.

Model System Overview
Nugget Browser: Visual Subgroup Mining and Statistical Significance Discovery in Multivariate Datasets
Zhenyu Guo, Matthew O. Ward, and Elke A. Rundensteiner
Discovering interesting patterns in datasets is a very important data mining task. Subgroup patterns are local findings identifying the subgroups of a population with some unusual, unexpected, or deviating distribution of a target attribute. However, this pattern discovery task poses several compelling challenges. First, computational data mining techniques can generally only discover and extract pre-defined patterns. Second, since the extracted patterns are typically multi-dimensional arbitrary-shaped regions, it is very difficult to convey in an easily interpretable manner. Finally, in order to assist analysts in exploring their discoveries and understanding the relationships among patterns, as well as connections between patterns and the underlying data instances, an integrated visualization system is greatly needed. In this work, we describe a novel visual subgroup mining system, called Nugget Browser, to support users in discovering patterns in multivariate datasets. We proposed a 4-level layered model that allows users to explore the mining result in different levels of abstraction. The nugget level mining results are represented as regular hyper-box shaped regions, which can be easily understood, visualized, and compactly stored. The layout strategies help users understand the relationships among extracted patterns. Interactions are supported in multiple related nugget space views to help users navigate and explore. The system accepts analysts' mining queries interactively, converts the query results into an understandable form, builds visual representations, and supports navigation and exploration for further analyses.
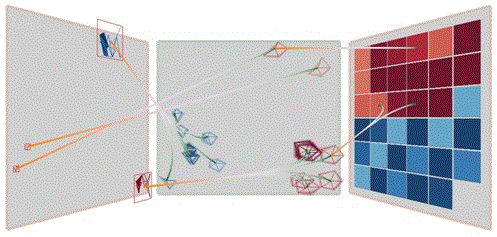
The bottom figure shows the nugget space view, including cluster view, nugget view, and cell view. We designed these three views based on our proposed a 4-level layered model. Users can click each data item in different layers to browse the extracted knowledge in different abstractions. The linking curves show the connections between two adjacent layers.

Nugget Space Exploration
Pointwise Local Pattern Exploration for Sensitivity Analysis
Zhenyu Guo, Matthew O. Ward, Elke A. Rundensteiner, and Carolina Ruiz
Sensitivity analysis is a powerful method for discovering the significant factors that contribute to targets and understanding the interaction between variables in multivariate datasets. A number of sensitivity analysis methods fall into the class of local analysis, in which the sensitivity is defined as the partial derivatives of a target variable with respect to a group of independent variables. Incorporating sensitivity analysis in visual analytic tools is essential for multivariate phenomena analysis. However, most current multivariate visualization techniques do not allow users to explore local patterns individually for understanding the sensitivity from a pointwise view. In this work, we present a novel pointwise local pattern exploration system for visual sensitivity analysis. Using this system, analysts are able to explore local patterns and the sensitivity at individual data points, which reveals the relationships between a focal point and its neighbors. During exploration, users are able to interactively change the derivative coefficients to perform sensitivity analysis based on different requirements as well as their domain knowledge. Each local pattern is assigned an outlier factor, so that users can quickly identify anomalous local patterns that do not conform with the global pattern. Users can also compare the local pattern with the global pattern both visually and statistically. Finally, the local pattern is integrated into the original attribute space using color mapping and jittering, which reveals the distribution of the partial derivatives.
The following figure shows the local pattern view. The focal point is placed in the center. For each neighbor, there are m bars corresponding to its m attributes, where a upward (downward) bar for an attribute indicates that the neighbor's value in that dimension is higher (lower) than that of the focal point. The target attribute value is mapped as Y, i.e., if a neighbor's target value is higher (lower) than the focal point's target value, it is located in the upper (lower) half. The X position indicates the neighbor's target value is higher (right) or lower (left) than estimated using the local regression line.

Local Pattern View for Interesting Neighbor Discovery
Acknowledgement
This XmdvTool project has been supported by NSF under grant
IIS-0812027.
|