VTK is a strong visualization toolkit in many application areas, including medical imaging, financial visualization, modelling, computational fluid dynamics, finite element analysis, and algrithm visualizations. For each case, the visualization design process is similar. Steps of the process are described below.
Step 1. Read or generate application-specific data and transform
it into one of the data representation types in the VTK
Often this first step is the most difficult one because we have to
write custom computer code, and decide what form of visualization data
to use. Forturnately, the elements of FEM are usually defined and chosen
beforehand. All we should know is how to transform the data format of elements
and parameters of FEM into that of VTK. The VTK data file format consists
of 5 basic parts:
Part 1: Header# vtk DataFile Version x.x ] (1)
Really cool data ] (2)
ASCII | BINARY ] (3)
DATASET type ] (4)
.....
POINT_DATA n ] (5)
.....
Step2. Choose visualizations for the relevant data within the application
Sometimes this means choosing or creating models corresponding to the
physical structure. Examples include spheres for atoms, polygonal surfaces
to model physical objects, or computational surfaes to model flow boundaries.
In FEM, the model is generally already chosen, for example, the linear
line segments, triangles, and tetrahedra as the basic one-, two-, and three-dimensional
elements. But sometimes we should generate more abstract models, such as
isosurfaces or glyphs, corresponding to important application data.
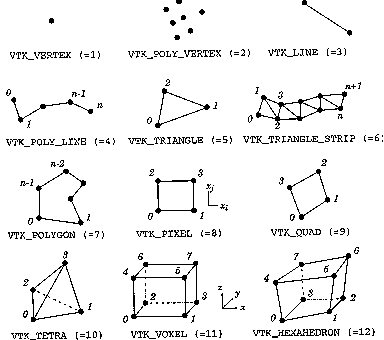
Currently, the cell types of VTK are:

Step 3. Combine the physical components with the abstract components
to create a visualization result
As all the physical components, abstract components defined and
mapped, we can begin the visualization pipeline to construct the application.
That is, get the visualization result from the Source, Filter, Mapper,
and Display processes.