Program Implementation

I. Porting

The first step in the implementation of my project was to port Prof. Rana's evolution strategies code to run in Borland C++ under Windows. This consisted of three phases.
First, I ported the code to run in text mode under the 32-bit Borland C++ compiler. The code had been originally developed on a 32-bit platform under the GNU compiler, so it was expected that this port would be confined to compile-time issues. It turned out that only minor semantic changes were required, and the work was fairly straightforward.
Next, I ported the code to 16-bit Borland C++, still running in text mode. I needed a 16-bit port because the Borland development environment only supports debugging of 16-bit applications under windows, and I certainly was not willing to proceed further in the implementation of my project without the aid of a debugger. With a few changes, I was able to get the code to compile as a 16-bit application; unfortunately, this application immediately crashed. With a little detective work, I was able to remedy this problem by changing a few ints to longs in some of the application's critical structures.
The final step in this porting process consisted of breaking what had previously been the contents of the application's main() function into a number of discrete chunks, which could be called appropriately by message handlers under the event-driven programming paradigm. That is to say, instead of the application starting up, reading a configuration file, and running until the user hits CRTL-C, it had to be able to start and stop (in response to the "Run" and "Pause" buttons), to send its output to window controls rather than to the console, and to allow the user to specify configuration options via dialog boxes, not startup files. This step required a significant amount of work, the result of which is illustrated in the screen shot below (Figure 4.1) of my prototype TESWindow.


Figure 4.1: An early implementation of TESWindow.

The "ES", "Network", and "Problem" buttons bring up dialog boxes that allow the user to change the evolution strategies configuration, to change the network architecture, and to load a new training set, respectively. The text to the right of the "ES" button displays the current evolution strategy, using the (mu,lambda) notation discussed in the Introduction. The text to the right of the "Problem" button displays the problem name, as well as the number of inputs, outputs and samples involved in the problem (the numbers to the left of the "i", "o", and "s", respectively). Next to the "Network" button is a readout of the current network architecture, which in this case is a feedforward network with 1 hidden layer and 5 hidden nodes per layer. The text to the right of the "Best:" label gives the lowest (best) fitness score of any network in the current population, calculated as an RMS error between the expected and actual outputs for each sample in the training set. And clearly, the text to the right of the "Generation:" label indicates how many generations the ES algorithm has been allowed to run.
The "Run" and "Pause" buttons serve to stop and start the execution of the ES algorithm. The "Reset" button erases the current population and allows you to start the ES algorithm from scratch. Finally, the "Plot" button brings up an instance of the window class TESGraphWindow, the development of which will be discussed in the next section.
Figures 4.2, 4.3, and 4.4 below illustrate the three dialog boxes developed for the main program window.


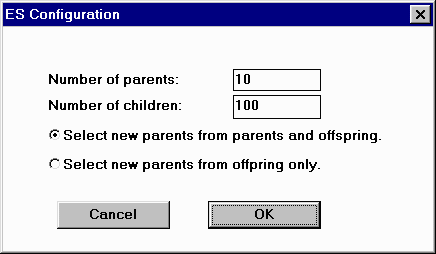
Figure 4.2: Evolution Strategies Configuration Dialog

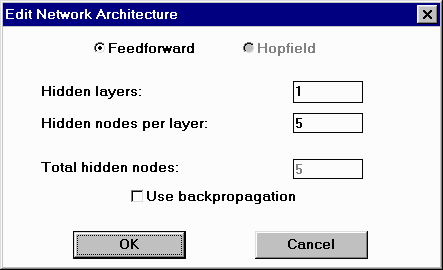
Figure 4.3: Network Architecture Dialog


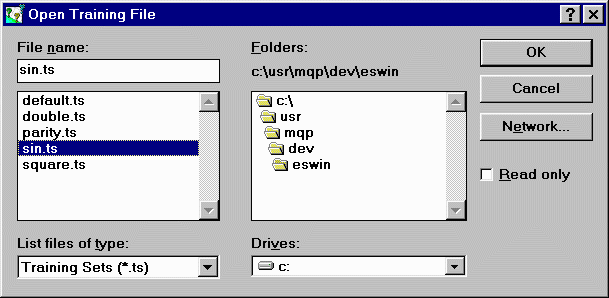
Figure 4.4: Load Training Set Dialog

II. Implementation of TESGraphWindow

In order to understand the development of the window class TESGraphWindow, it is necessary to appreciate a misconception that existed in my mind when first prototyping this window. The purpose of TESGraphWindow is to display a plot of the best, worst, and mean networks of each generation, i.e. to display fitness scores. For some reason, I imagined that these fitness scores were going to start off very large, and then rapidly decrease by orders of magnitude during the training process. I imagined that in some cases, a graph using a linear scale might not be very helpful, while in other cases a linear scale would be the best choice. For this reason, I created a window class with a menu that allows the user to switch between a linear, logarithmic, and sigmoid scale. A screen shot of this window class (Figure 4.5) is provided below.


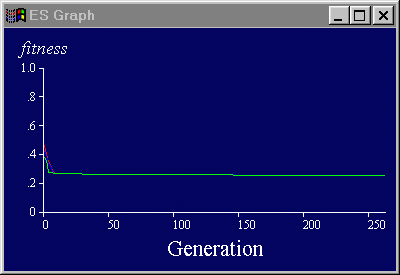
Figure 4.5: Original implementation of TESGraphWindow.

The TESGraphWindow displayed in Figure 4.5 depicts the fitness scores of networks trained to approximate a sine wave over about 5000 generations. The red line indicates the maximum (worst) fitness score for a given generation; the green line represents the best score, and the blue line represents the mean. I had not, at this point, added a vertical scale to the graph.
Shortly after creating this prototype, I realized I could save myself and the user some time by calculating the fitness scores using a Pearson correlation, that is a statistical correlation between the expected and actual output, which always lies within the range 0 to 1. By normalizing the fitness scores in this way, I could make it easy to compare rates of convergence across different problem sets, plus I would avoid the extra programming effort of having to introduce three different vertical scales (which is harder than might be expected).

Figure 4.6: Final implementation of TESGraphWindow.
It was with these considerations in mind that I created the version of TESGraphWindow that you see to the right of this text (Figure 4.6). The "Scale" menu has been removed, and all the fitness scores fit nicely within the range 0 to 1.
As it turns out, I did not end up actually using the Pearson correlation to compute fitness scores. The fact is that most neural networks use the sigmoid activation function for their output layer. For these networks, the RMS error, which is a much more common measure of fitness in the neural network world, is guaranteed to be between 0 and 1, since the outputs themselves lie in the range -1 to 1. For networks that use other activation functions in their output layer, and in particular the linear activation function, it is possible for the fitness scores to be above 1, but in my experience, they usually do not stay that way for very long. Thus, one limitation of TESGraphWindow is that it "cuts off" fitness scores that are greater than 1, but, from what I have seen, this limitation has proven to be of little practical harm.

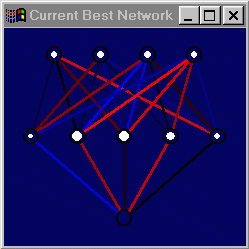
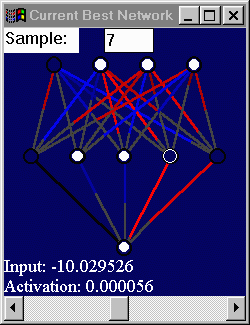
III. Implementation of TNVisWindow

Figure 4.7: First iteration of TNVisWindow.
Figure 4.7 to the left of this text illustrates the first iteration of the TNVisWindow class. In this diagram, as indicated in the Introduction, the diameter of the white circles is proportional to the activation of each node. In this prototype, the strength of a weight is mapped linearly to the brightess of the line used to depict it, with blue lines representing positive weights, and red lines representing negative weights. The black lines used to represent a number of the weights in this diagram were originally thought to simply be very dark blue lines that represented near-zero weights, but in fact turned out to represent a bug in the program.
Figure 4.8: TNVisWindow, take two.

To the right of this paragraph (Figure 4.8), you will see the second iteration of this window class. This version uses a redundant mapping of both line brightness and line length to weight values, with the brightness mapped linearly to the weight and the line length mapped directly (directly proportional). In addition, this version of TNVisWindow allows the user to "highlight" a certain node in the network by clicking on it. The second node from the right of the first hidden layer is highlighted in this picture. When a node is highlighted, its input and activation are displayed at the bottom of the window. This, plus the ability to switch between samples using the horizontal scroll bar, allows the user to easily monitor the inputs and outputs of a given node across a variety of problem samples. The sample display is also editable, so that it is possible to jump directly to a specific sample.
You will notice that the insidious black line bug is still present in this visualization.

Figure 4.9: TNVisWindow incorporating
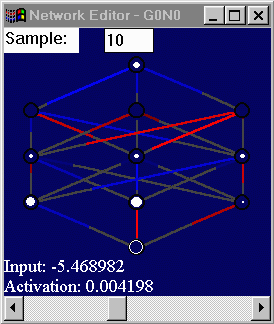
visualization of mutators associated
with each weight.
This next version of TNVisWindow (Figure 4.9) illustrates the visualization of the mutators associated with each weight in addition to the weights themselves. A gray bar has been drawn perpendicular to each weight, with the absolute value of the associated mutator mapped linearly to the length of the green line segment overlaid on top of it, and redundantly, linearly mapped to the green line's brightness. Note that, unlike in the case of weights, there is no need to distinguish between positive and negative sign using color, since a Gaussian mutation with a standard deviation of -x, where x is the mutator, is mathematically equivalent to a Gaussian mutation with standard deviation x.
By examining this picture, one can quickly see which weights have the largest associated mutators, and thus are the most "volatile". In cases where only the weights need be examined, the user can turn the display of volatility on and off through an option on the "View" menu.
The next step in the implementation of TNVisWindow was to add the option to refine a network's weights via the error-backpropagation algorithm. By clicking the "BackProp" option on the "Network" menu, the user can bring up a "Backprop Control" window, allowing the backpropagation algorithm to run for any number of iterations. After each iteration, the TNVisWindow is redrawn, so that the weight changes are animated as the algorithm runs. The user can pause the execution of the algorithm using the "Pause" button, and resume it with the "Resume" button. The current iteration and fitness score are displayed in the Backprop Control window.
As a final step in the development of TNVisWindow, I added the ability to modify a weight by clicking on the end of it and dragging it to a new location.
Figures 4.10 and 4.11 below illustrate, respectively, an instance of TNVisWindow and its associated Backprop Control window, created in response to the "Backprop" menu command. You will notice that positive weights are here represented with cyan instead of blue; this is to make it easier to gauge the brightness of the weight against a dark blue background.


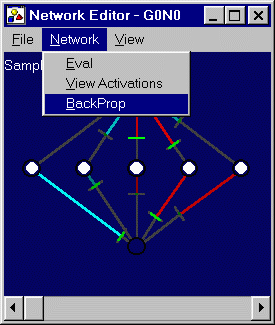
Figure 4.10: Final version of TNVisWindow.

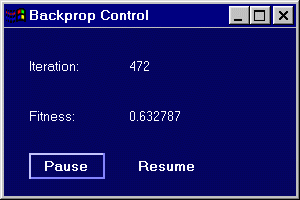
Figure 4.11: Associated Backprop Control window

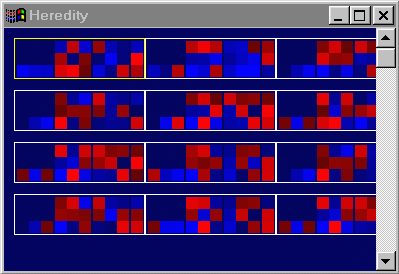
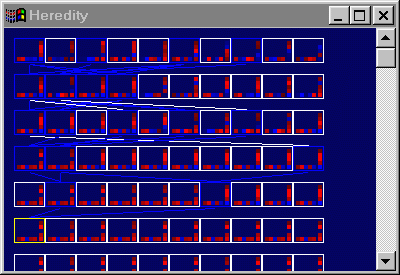
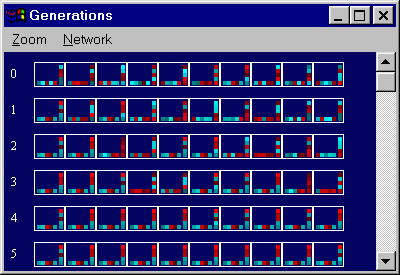
IV. Implementation of THeredityWindow & TGenerationWindow

Figure 4.12: Compact matrix representation of neural networks.
In order to display all the networks of a generation in a single window, it was necessary to come up with some sort of compact network display. In regards to a Hopfield network with n nodes, Prof. Alvarez brought to my attention the idea of representing the network as an n by n matrix (Beddow90), with each square in the matrix color-coded to represent the corresponding weight, so that the square in the ith row and the jth column would represent the weight associated with the edge going from node i to node j. I was able to extend this idea to feedforward neural networks in a natural and intuitive way. By representing each layer of weights using a separate matrix, I was able to arrange these matrices in such a way that the execution of the network would be similar to the process of matrix multiplication, applied to the matrices in the compact network representation.
Figure 4.13: Neural network represented in upper
left corner of Figure 4.12.
Consider a feedforward network with n layers. The weights in such a network can be grouped into n-1 "weight-layers", where all the weights in weight-layer i flow from a node in layer i to a node in layer i+1. The number of weights in the ith weight layer will be LayerSize(i)*LayerSize(i+1), where LayerSize(j) is defined as the number of nodes in the jth layer of the network. It is natural then, to display the weights in the ith weight-layer as a matrix with LayerSize(i) rows and LayerSize(i+1) columns. In such a matrix, the square in the jth row and the kth column will represent the weight going from node j in layer i to node k in layer i+1. If we display the matrices for each of the i-1 weight-layers in order, from left to right, we will arrive at an interesting property, to be described below.
The network depicted Figure 4.13 to the right of this text corresponds to the compact matrix representation in the upper left corner (inside the yellow box) of Figure 4.12 above. The compact matrix representation consists of a 1x3 matrix, followed by two 3x3 matrices, followed by a 3x1 matrix. In this early version of TGenerationWindow, the individual matrices were not spaced apart by very many pixels, so it may somewhat confusing to try to extrapolate the network architecture from the compact matrix representation alone. But if you look at the network as depicted in the TNVisWindow, then find the corresponding matrix, you should be able to see how the colors in the squares correspond to those used to draw the weights. Now each of the squares in the compact matrix representation is an encoding of a weight value. Consider what would happen if we were to multiply the matrices in the compact matrix representation together, proceeding from left to right. When we first multiplied the 1x3 matrix by the adjacent 3x3 matrix, we would obtain another 1x3 matrix, the ith entry of which would be the dot product of the first (and only) row vector in the 1x3 matrix (representing the three weights emanating from the input node), and the ith column vector in the 3x3 matrix (representing the three weights that head toward the ith node in the third layer). Thus, if we ignore activation functions for the moment, and assume an input of 1 in the input node, the three entries in the resulting 1x3 matrix will be precisely the inputs to the third (second hidden) layer. If we were to continue to multiply all the matrices in the compact matrix representation, we would obtain the transformation matrix (assuming linear activation functions) that maps input to output. Though I doubt that most people could simulate the execution of a network by doing the matrix multiplication in their heads, the property makes for an intuitive representation of the weights in a feedforward neural network.
Figure 4.14: An early version of TGenerationWindow.
The illustration to the right (Figure 4.14) represents my original attempt to display the inheritance relationships among the networks in a population, across multiple generations. Each row of white squares represents a generation of networks, placed from left to right in decreasing order of fitness. When breeding takes place in evolution strategies, there are two sets of parents involved. One set of parents is bred to arrive at the child's weights; we will call these the weight-parents. Another set of parents is bred to determine the set of mutators associated with each weight; we will call these the mutator-parents. In the figure, a blue line between two networks means that the network that is higher in the window (and therefore in an earlier generation) is the weight-parent of the lower network. Similarly, a green line between two networks is used to indicate that one is the mutator-parent of the other. Needless to say, the lines get somewhat cluttered with any significant population size. For this reason, I decided to display the parent-child links only for a network that has been selected (by clicking on the white box). In Figure 4.14 (below and to the left), you can see the parent links for the network selected (in the yellow box). For the sake of clarity, and because mutator inheritance is not particularly relevant, the links for the mutator-parents have been dropped in this figure.
Another consideration that comes up when depicting networks in this way is of what to do when a network in the parent hierarchy has survived from one generation into the next. Since the networks in each generation are ordered according to fitness, it may be that a network that was in the leftmost slot of one generation drops down to the fourth or fifth slot in the next. In such cases, I chose to draw a white line connecting the two boxes for identical networks.
For the final version of TGenerationWindow (Figure 4.15), I added generation numbers to the left of each row, as well as a "Zoom" menu (allowing the user to shrink and enlarge the compact matrix display), and a "Network" menu with options to bring up a TNVisWindow or TFamilyTreeWindow for a selected network. The "Zoom" and "Network" menus were implemented as part of the base class THeredityWindow, so that they could be used by TFamilyTreeWindow. Additionally, the code to display the compact matrix representation is part of the base class THeredityWindow.

Figure 4.14: A refined version of TGenerationWindow.
Figure 4.15: Final version of TGenerationWindow.

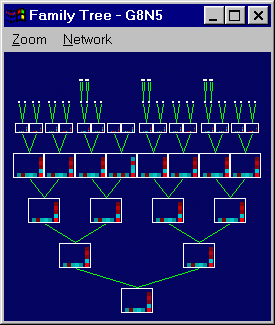
V. Implementation of TFamilyTreeWindow

Figure 4.16: Final version of TFamilyTreeWindow.
Figure 4.16 to the left illustrates an instance of the final version of the window class TFamilyTreeWindow, the implementation of which was fairly straightforward. Building on the compact matrix representation described in the previous section, I depicted the ancestors of a given network as a family tree. Since, at the upper levels of the tree, there are many more nodes than at the lower levels, I implemented an algorithm that reduces the display size of the compact matrix representation subject to the available display width.
You will notice in this diagram that not all levels of the tree are completely filled. The reason for this is that, when a network survives for more than one generation before becoming a parent, its children will not have as many ancestors as those descended from a series of parents that only survived for single generations. Thus, though nodes at the same level of the tree will always have the same degree of grand-parentage, they will not always be from the same generation. An improvement over this scheme might be to organize the levels of the tree according to generation, so that parents who had survived more than one generation would simply have longer links, where a link is represented by a green line in the figure.

VI. Implementation of TESWindow

Though it may be the most important window class in this project, the implementation of TESWindow was relatively easy compared with that of other window classes. Building off my original prototype (Figure 4.1 in the "Porting" section above), I changed the "Best:" and "Generation:" labels into buttons, which brought up, respectively, an instance of TNVisWindow depicting the best network in the current generation, and an instance of TGenerationWindow. The only other major change made to this window class was the implementation of a new, "IE4-Style" button class that takes up less screen space and allows the buttons to be laid out more efficiently within the window. As a final step, I added menu equivalents for all of the button functions. Figure 4.17 below illustrates the final version of TESWindow.


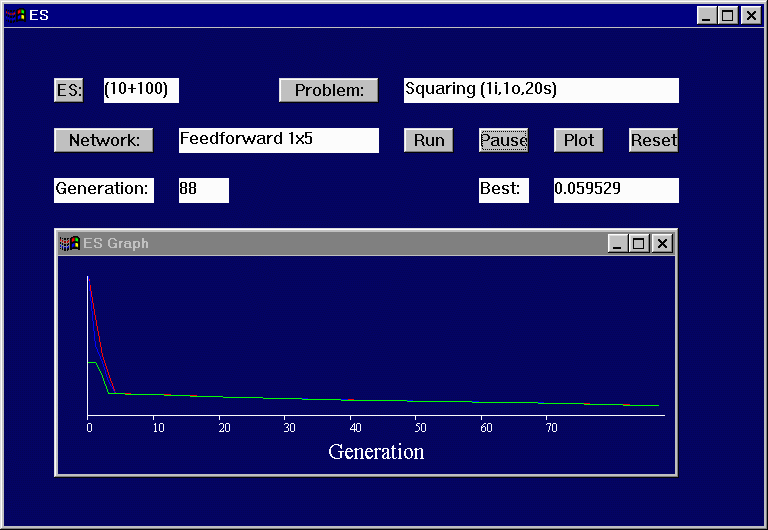
Figure 4.17: Final version of TESWindow.