
SpiralGlyphics is an interactive visualization tool written in Java for exploring multivariate data which may be cyclic in nature. It is designed to be portable and extensible. Below we outline some of the features of the program.
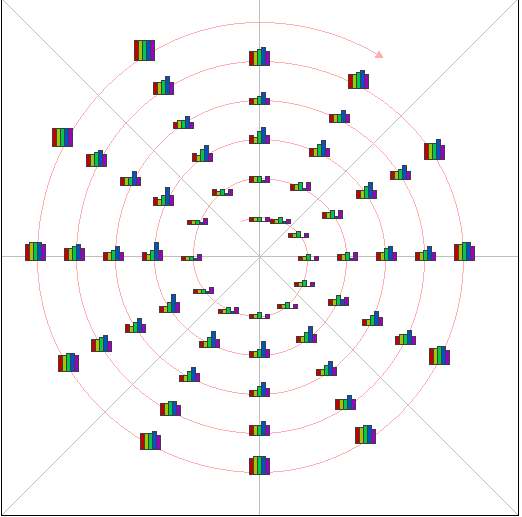
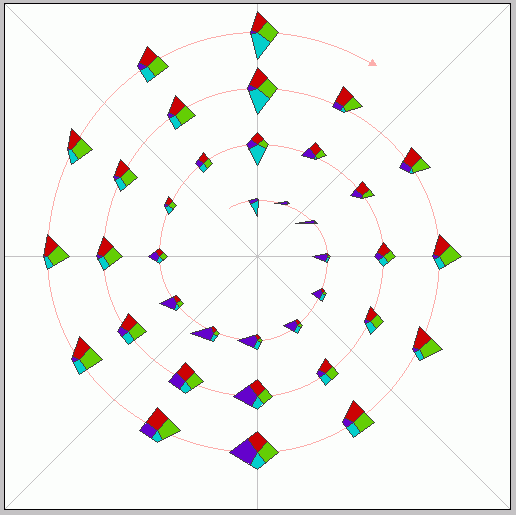
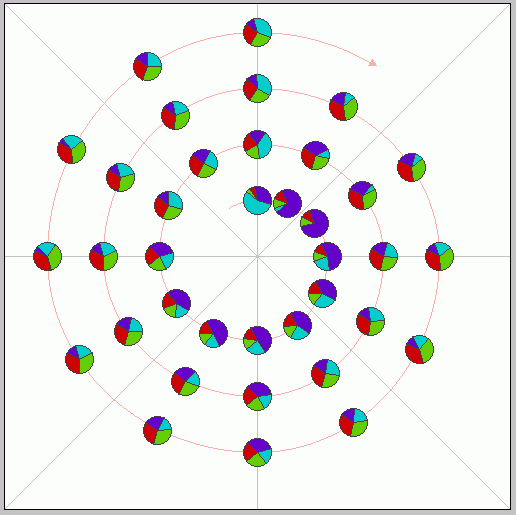
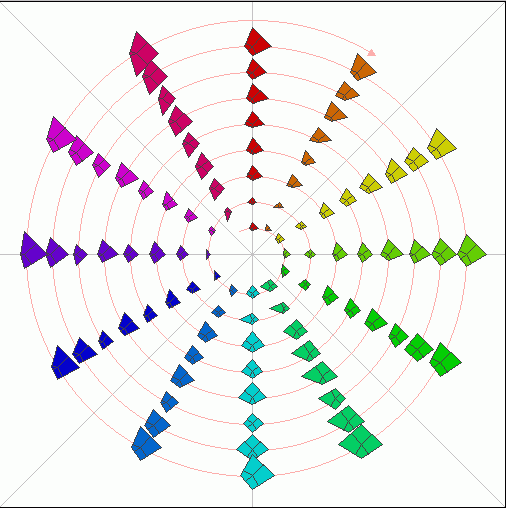
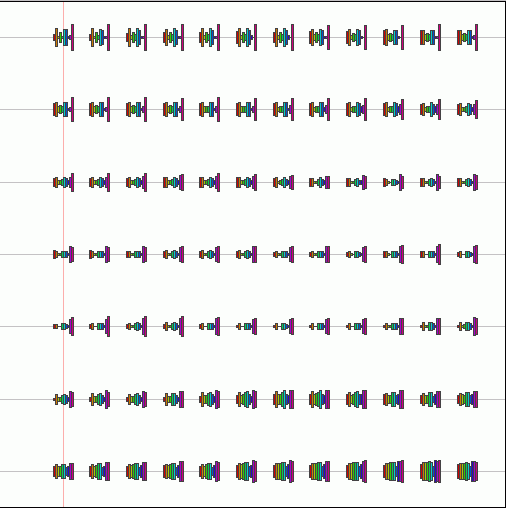
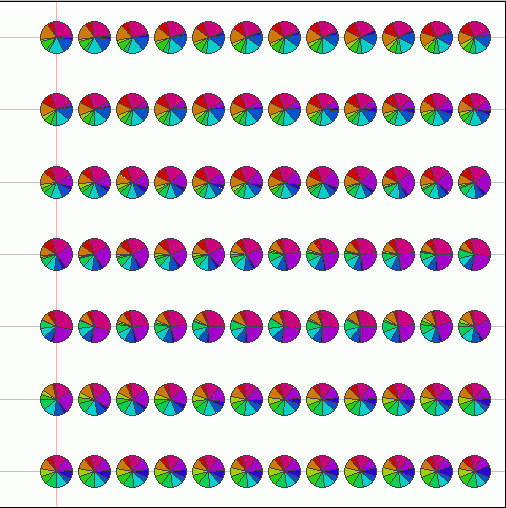
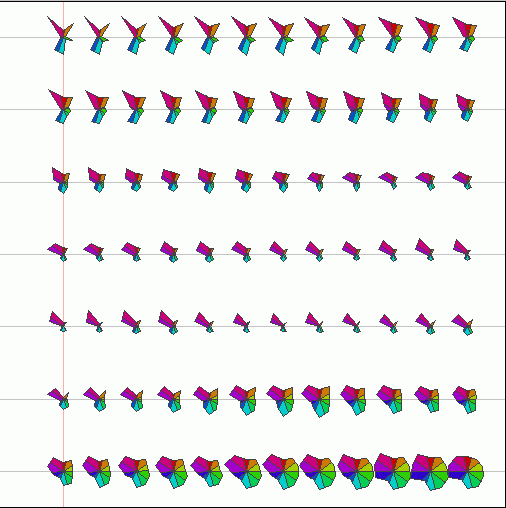
Glyph Types: Currently, SpiralGlyphics supports three types of glyphs. A Bar glyph (related to a profile glyph) is formed by gluing N (the number of dimensions) equal width rectangles together, where the height of a particular rectangle is proportional to the corresponding dimension for the data entry. The rectangles are aligned along the center (which makes the resulting shape look a bit like an automobile crankshaft) or the base (as in a bar chart or profile glyph). A Star glyph (related to a Metroglyph) has N equally angled rays emanating from a central point, with the lengths again proportional to the dimensional values. A polygon is then drawn connecting the endpoints of the rays. A Pie glyph is basically a pie chart for each data entry, with the slices proportional to the normalized values of the dimensions.
Figure 1-4. Examples of bar (profile and centered), star, and pie glyphs.


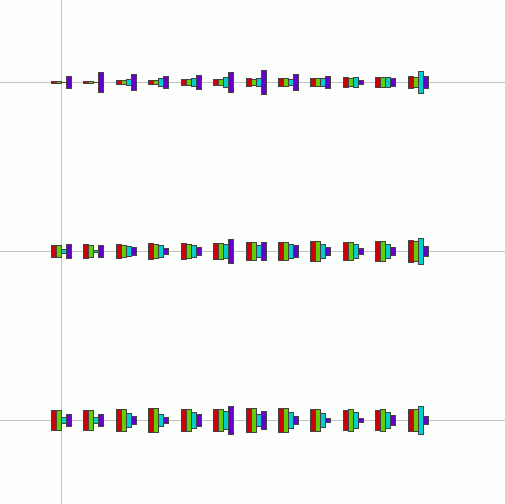
Glyph Placement: The different types of glyphs can be displayed in several configurations on the screen, and each placement strategy has its strengths and weaknesses in terms of screen utilization and the detection of inter- and intracycle patterns. The Spiral view, from which the tool derives its name, arranges glyphs so that those sharing a position within a cycle are along the same ray emanating from the center, while those within a given cycle share a specific ring of the spiral. This allows both types of relationships to be visible, though it does not use the screen space effectively. The Stacked view simply lays the glyphs out in a grid, where each row contains a single cycle and each column contains the glyphs from a particular position in the cycle. The main difficulty with this display is detecting associations between the end of one cycle and the beginning of the next, as this involves scanning across the display. The Linear view is the traditional display method, where data points are placed along a single horizontal axis. In SpiralGlyphics, we place the glyphs in a row, but also plot the individual dimensions above the row of glyphs, allowing easy access to patterns in single dimensions. Users can click on any data point and see highlight bars on that cycle position in all other cycles (see Figure 8).
Figures 5-8. Examples of spiral, stacked, and linear glyph arrangements.

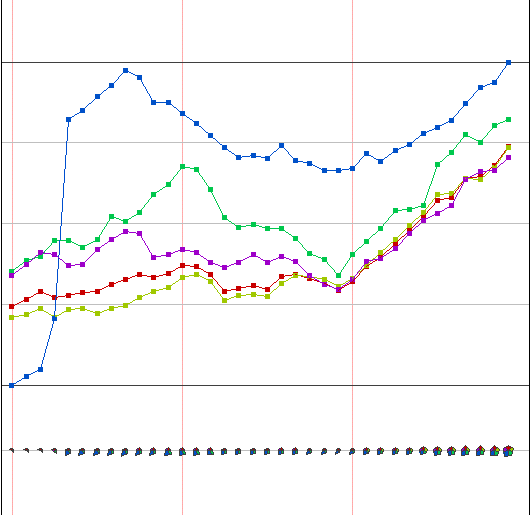
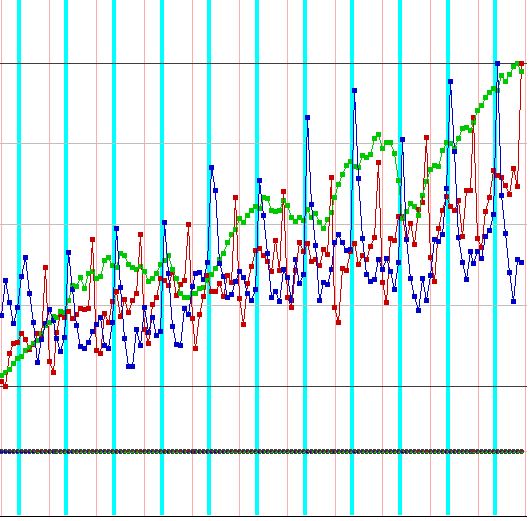
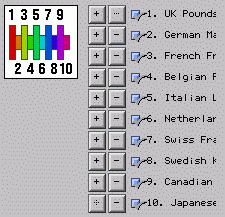
User Interface: SpiralGlyphics is designed to provide the user with significant flexibility and customization of the display as well as the data being presented. Once a user specifies a file for viewing, he or she can reorder the dimensions (as shown in Figures 7 and 8 by the + and - buttons to the left of the dialog box for moving a dimension up or down the list) or disable one or more dimensions (using the toggle box next to the name field). Radio buttons are used to select the glyph and placement strategy (see Figure 9), and sliders are used to specify the number of cycles to display, the cycle length, and the scale factor applied to the glyphs (Figure 10). Not shown is the slider used to control the starting point of the subset of the data to be displayed. This slider also shows the relationship between the displayed subset to the entire data set. Another useful option is the ability to color the glyphs based on their position in the cycle, rather than using color to differentiate the dimensions. An example of this is shown in Figure 11.
Interactivity is critical when one is working with large data sets or with large numbers of dimensions. As seen in Figures 12-14, the larger the number of glyphs on the screen, the smaller the glyphs, which tends to lose some of the detail in exchange for a global overview of the data. Starting from this overview, one can search for interesting features and focus attention by both removing uninteresting dimensions and also reducing the number of visible cycles. The performance of the system is such that these changes can be done in a dynamic, real-time fashion for data sets of moderate size.
Figures 9-10. Data dimension display for toggling inclusion and reordering (for small and large numbers of dimensions)..

Figures 11-12. Other interface components for selecting style of display and number/length of cycles.

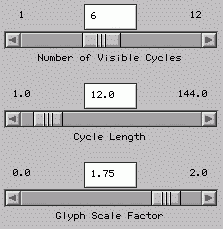
Figure 13. Glyphs can be colored by location in cycle rather than by dimension.
Figures 14-16. Display can handle many dimensions cycles by scaling glyphs.
Input File Format: Data files in SpiralGlyphics are in ASCII format. After a set of view parameters in the format "Parameter_name: Value", each data item is simply a row of integer or floating point values. Each of the parameters can be modified within SpiralGlyphics, and the changes may be saved with the data file. The definitions for the parameters are given below.
tMinimumUnit, tMinValue, tMaxValue, and tValue provide control over the number of entries and how they are indexed (usually this is the time variable). CycleLength and VisibleCycles describe how long the cycles are and how many to display, and GlyphScale gives a size factor for the glyphs. GlyphType and ViewType specify which glyph to use as well as select the configuration of the glyphs (spiral, stacked, linear). AutoNormalize forces all glyphs in the current display to be normalized to a range of 0 to 1. ShowLabels, ShowGuides, and ShowSpiral toggle on and off the various aids to interpreting the displays. ColorPerGlyph is used to specify whether you want color to be used for the individual dimensions or for the entire glyph, in which case color indicates the entry's position in the cycle. InToOut allows the order of the data points to be reversed, which is sometimes useful in the spiral display. ShowLinearPlot toggles on and off the display of glyphs along the bottom of the linear plot. TotalDims is the number of dimensions and EnabledDims is the count on the number of dimensions currently active. NumDataPoints holds the number of data points. DimMap is used to specify the order of the dimensions (specified as a list of numbers from 0 to TotalDims-1). DimLabels is a list of strings to label the dimensions.
After the keyword Data: , the list of data points is given, with each line starting with a label field (if the data have no intrinsic names, you can just give each a number). Each entry can be integer or real, and are comma separated.
This sample shows five variables from the New York Stock Exchange over a 9 year period.