|
|
Case Study:
Ulysses
Dust Experiment
This data
set consists of 968 data points acquired over 2 years from the
Ulysses mission. 33 parameters are included: Raw data: No., date,
impact time, CLN, AR, SEC, IA, EA, CA, IT, ET, EIT, EIC, ICC,
PA, PET, EVD, ICP, ECP, CCP, PCP, HV and evaluated data: R, LON,
LAT, D_Jup, rotation angle (ROT), instrument pointing (S_LON,
S_LAT), speed (V), speed error factor (VEF), mass (V) and mass
error factor (MEF). It was obtained in ASCII format via the Ulysses/Galileo
Dust Experiment Home Page (http://kosmopc.mpi-hd.mpg.de/dust/ughome.html)
and converted to XmdvTool format. Details on the data sets are
available in a series of articles by Grun et. al. in Planetary
Space Science, Vol. 43, No. 8 (1995).
Overview
Images
We've eliminated
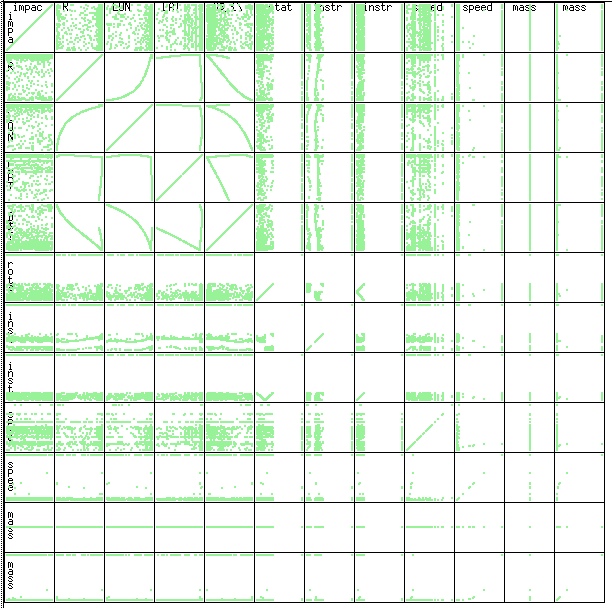
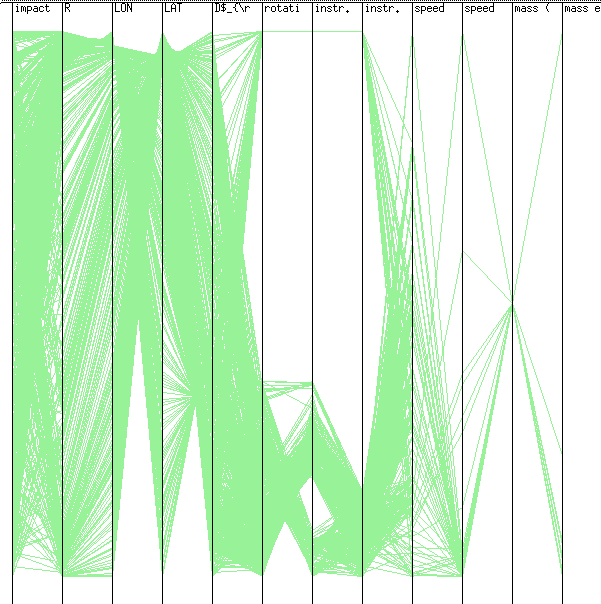
the raw data fields except for the impact time, and then displayed
the data both as a scatterplot matrix and using parallel coordinates.
The Longitude/Latitude plot does not have a smooth flight path.
This turns out to be caused by the flight plan, which diverted
Ulysses to Jupiter during the time of this data gathering. The
missing values (which are assigned high values for completeness)
tend to through off the distribution of the plots. A better method
for dealing with these missing values is needed. This data also
highlights a limitation in XmdvTool, namely that data are imported
as single-precision rather than double-precision floats. The masses
of all dust particles mapped to the same value (0) because of
this.


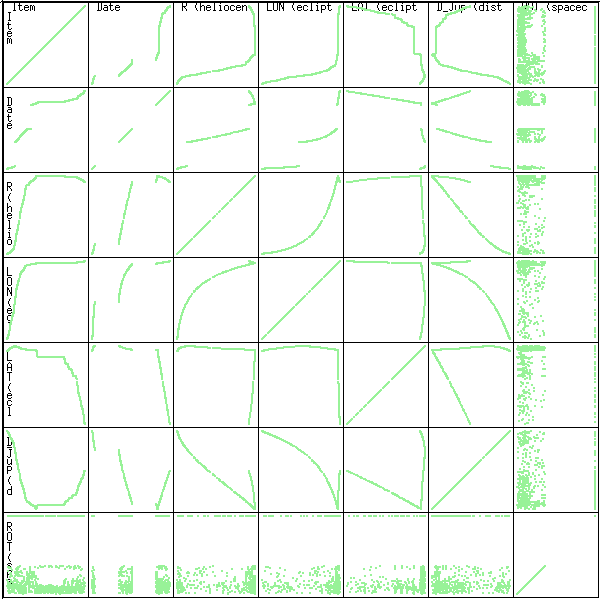
Another problem
with plotting this data is when using the Date field, which is
specified as the year (90, 91, 92) followed by the date count
from the start of the year (1 - 365). We concatenated these 2
numbers, which left gaps between the end of one year (90365) and
the start of the next (91001). An interesting problem would be
to eliminate these gaps to avoid distortions in the plots. This
also occurs with mm-dd-yy date representations. The scatterplots
below show an example of these gaps.

Matthew
O. Ward (matt@cs.wpi.edu)
|