|
|
Case Study:
Venus Plasma Data
This data
set consists of 8784 data points acquired over 1 month (Jan. 92)
from the Pioneer Venus Orbiter. 7 parameters are examined: Date,
hour, latitude, longitude, plasma velocity, plasma density, and
plasma temperature. It was obtained in ASCII format via NSSDC
COHOWeb and converted to XmdvTool format.
High Plasma
Temperature
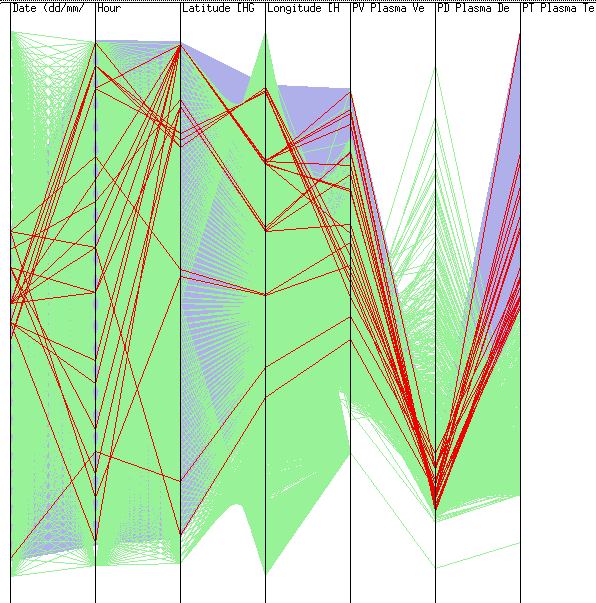
This image shows
a parallel coordinates view of the data, with a brush formed by
dragging over the region with high plasma temperature data. As can
be seen, this data occurred over a small number of days, and has
corresponding low values for plasma density. 
Statistics
on Individual Parameters
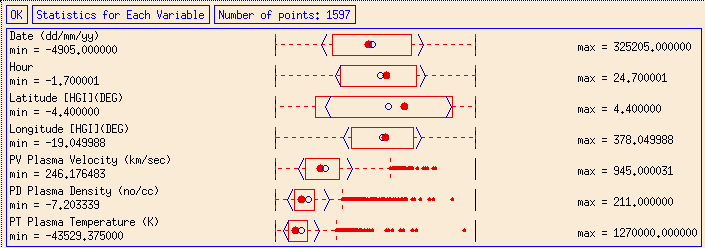
This image shows
a modified Tukey Box Plot for each dimension. The red circle shows
the median value, the red box shows the outline for the middle 2
quartiles, the red dashed lines shows the points within 1.5 times
the 25-75 quartile range of the median, and red dots indicate outliers.
The blue circle shows the mean value and the blue angle brackets
show the standard deviation. Missing data points (represented by
values such as 999.999 within the data set) have been filtered out
by the brush. The data count shows that nearly 5/6 of the 8784 points
have missing values. 
Temporal
and Spatial Distribution of Missing Data
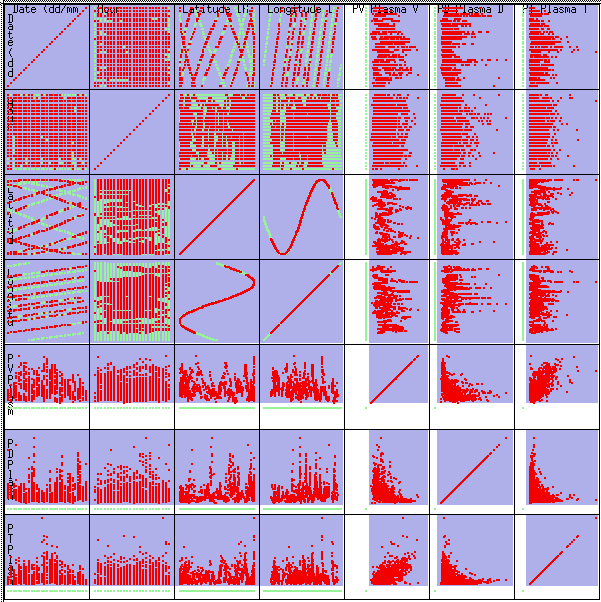
This scatterplot
matrix shows (in red) the valid data and (in green) the data with
missing parameters. The Date/Hour plot shows the time period of
the gaps, while the Longitude/Latitude plot shows the region of
the missing data. 
Matthew
O. Ward (matt@cs.wpi.edu)
|