Dynamic scene, single frame, single simulation
Time slice of single frame, single simulation visualization.
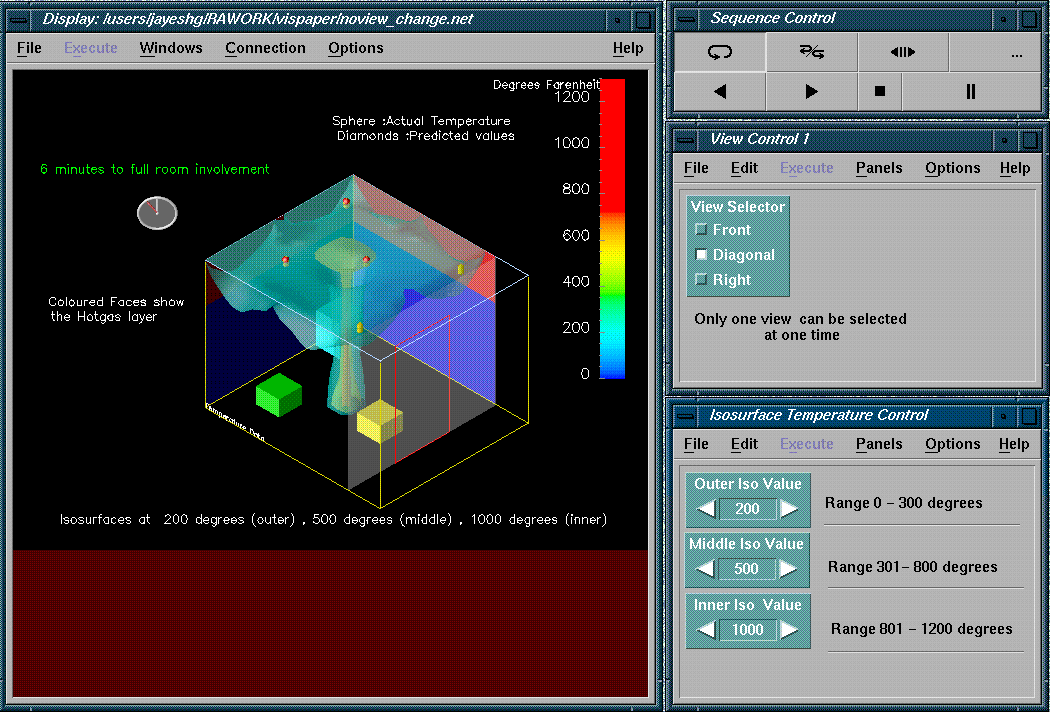
Sensors are indicated as glyphs along the
ceiling, with their state indicated
by color. The top of the glyph shows the actual sensor state and the bottom
indicates the state as predicted by the simulation. The hot gas layer is
projected onto two walls, again using color to differentiate hot gas from cool
gas. Temperature is represented by either colored slabs or multiple nested
isosurfaces, with transperancy used to provide vuews of the inner
isotherms.
[Back] [Next]