Releases
Spring 2014
The initial prototype of the MATTERS system was developed in Spring 2014 based on Spring framework, fueled by a spatio-temporal data model, and using postgres as data warehouse:
Summer 2014
Over the Summer a robust software redesign was completed. The prototype was developed into a stable system.
Academic year 2014 / 2015
Development continued with a user interface redesign. For the front end the site was converted to use bootstrap for responsive design allowing for use of the site on mobile devices. More ways of viewing the data were developed through the use of multiple table views, D3 charts to display data over time and across states, and improvements were made to the heatmap of the United States. Students worked with an expert in User Interface Design from MITRE corporation, as well as designers from Mesh Design Agency.
Concurrently, an MQP team developed an Administration Center for the management of new data sources. Students worked with an expert software engineer from MITRE corporation. Mitre also performed a comprehensive evaluation of the security and performance of the system.
Version 1.0 of MATTERS was launched in February 2015.
Summer 2015
Over the summer a user study was performed by Bentley University to evaluate the usability of the site. In response to this feedback, students made a series of improvements to the site. Navigation and ease of use were addressed.
Fall 2015
MATTERS version 1.1
A new and improved version of the site was released in October 2015, incorporating changes made over the summer. In response to feedback from the user study, steps were taken to improve the look and feel and site navigation.
New Features MATTERS 1.1:
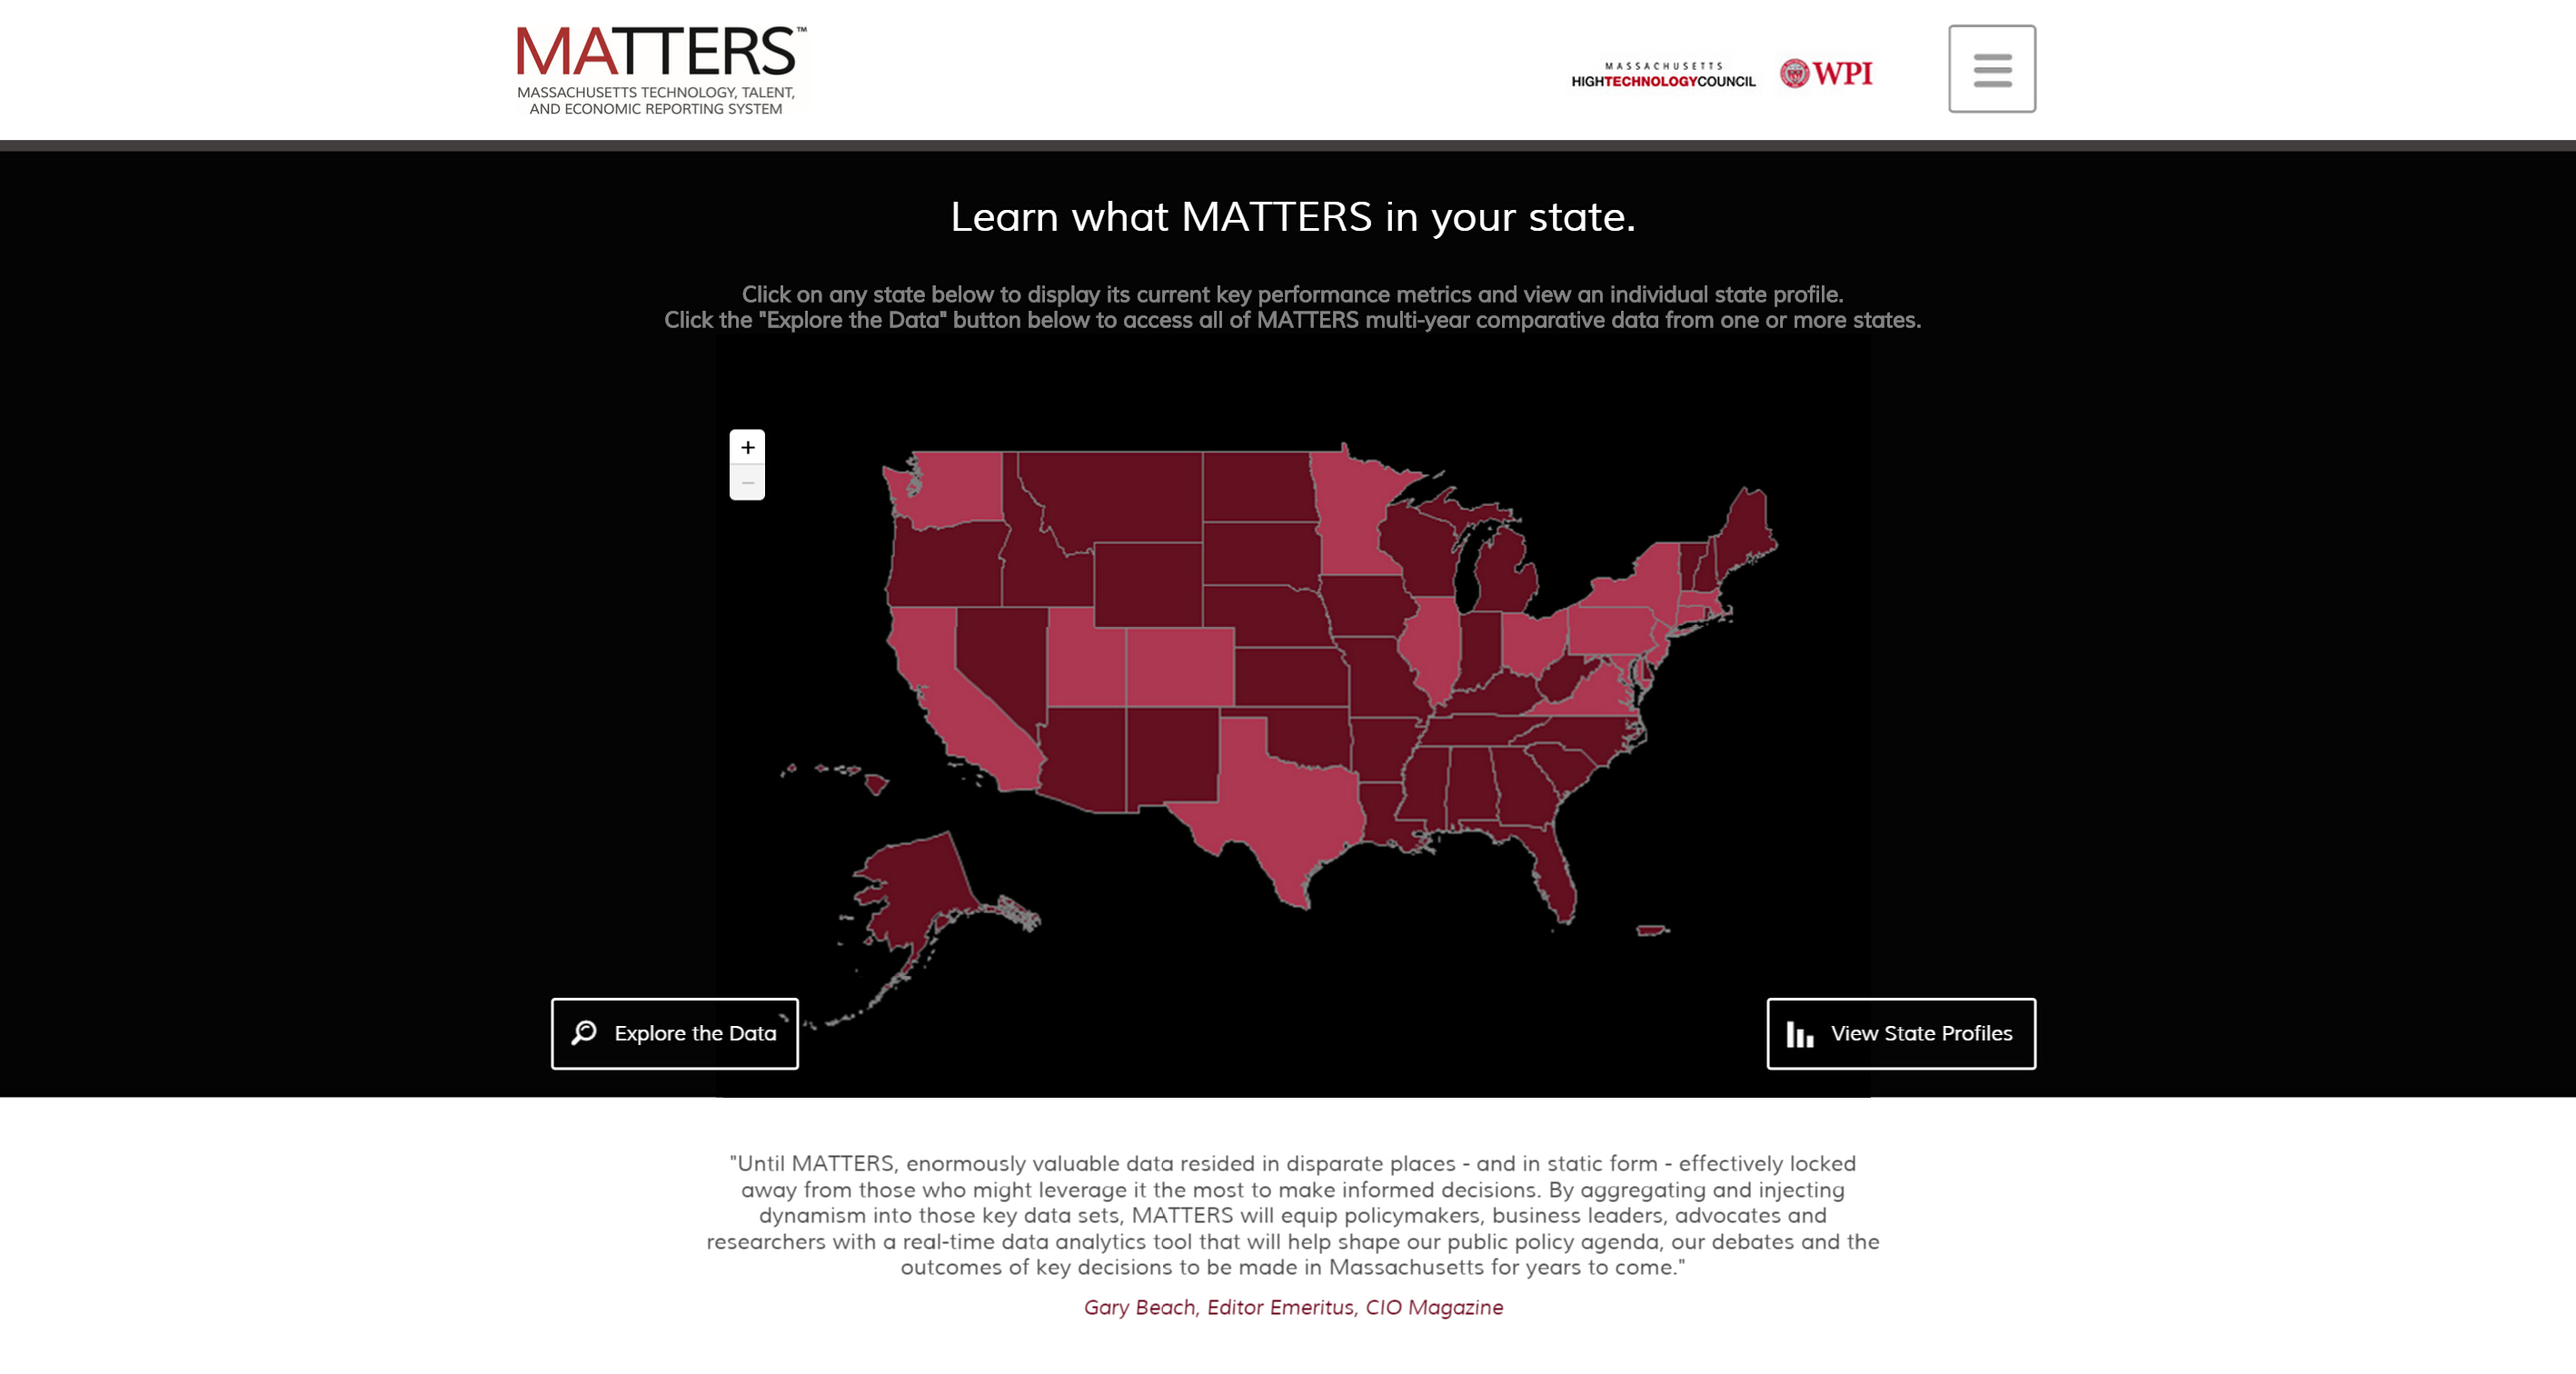
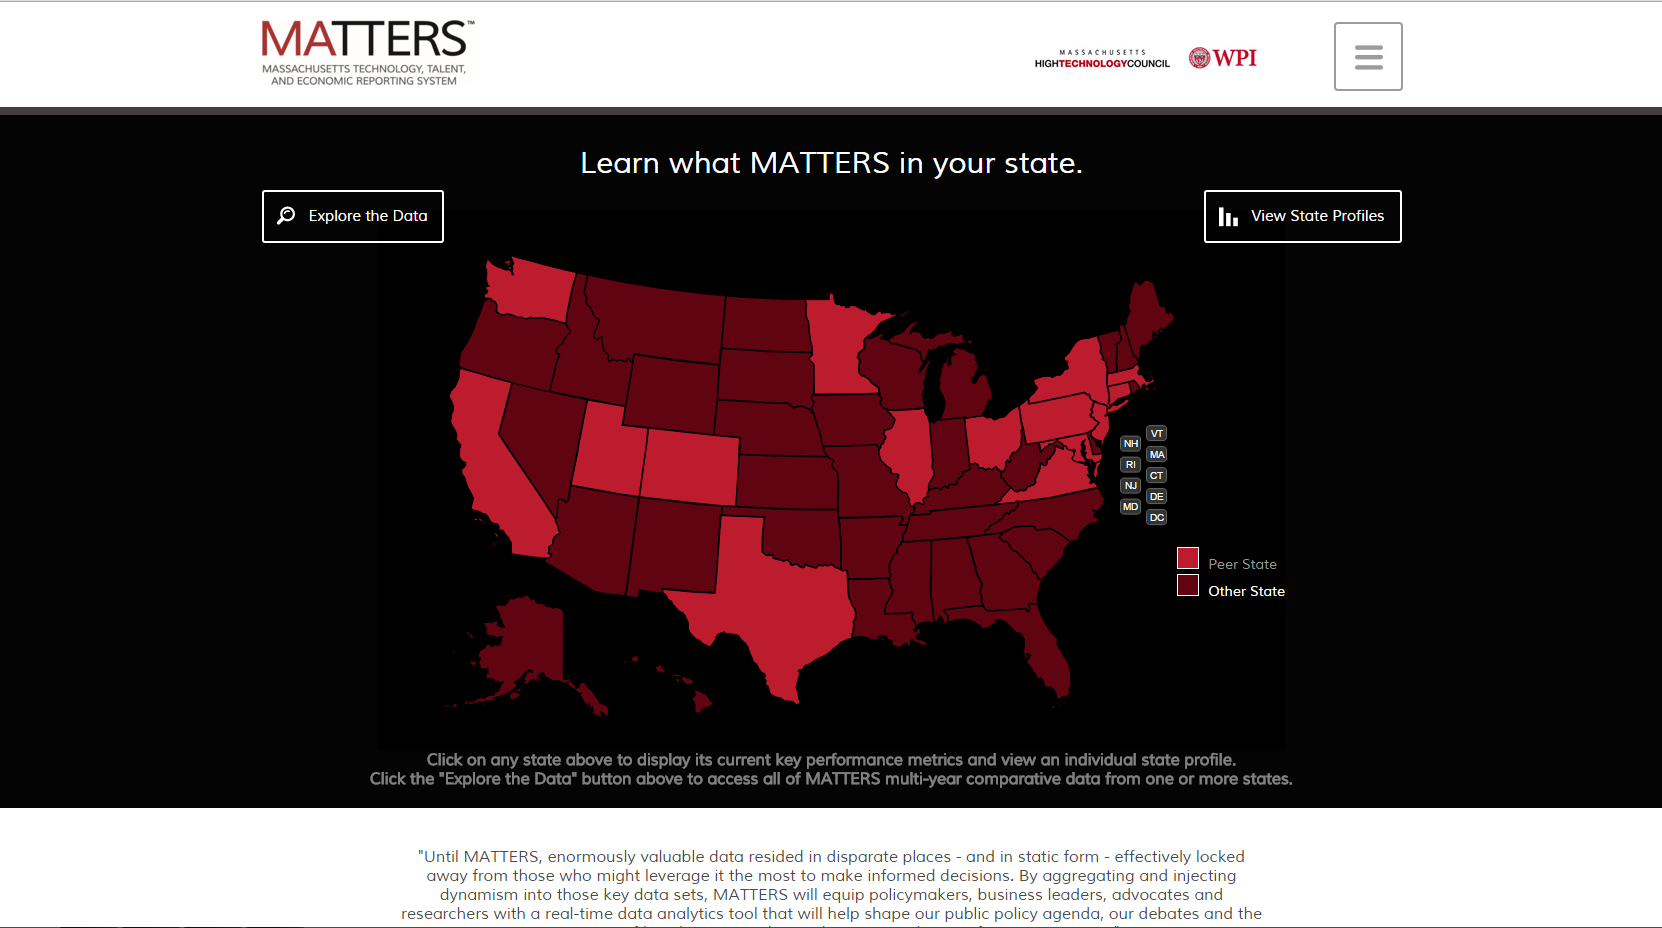
- Landing Page Look and Feel with improved site navigation, more user friendly map.
- Dynamic State Profile Pages reflect the most up to date data. Trend indicators for each metric show changes from the previous year.
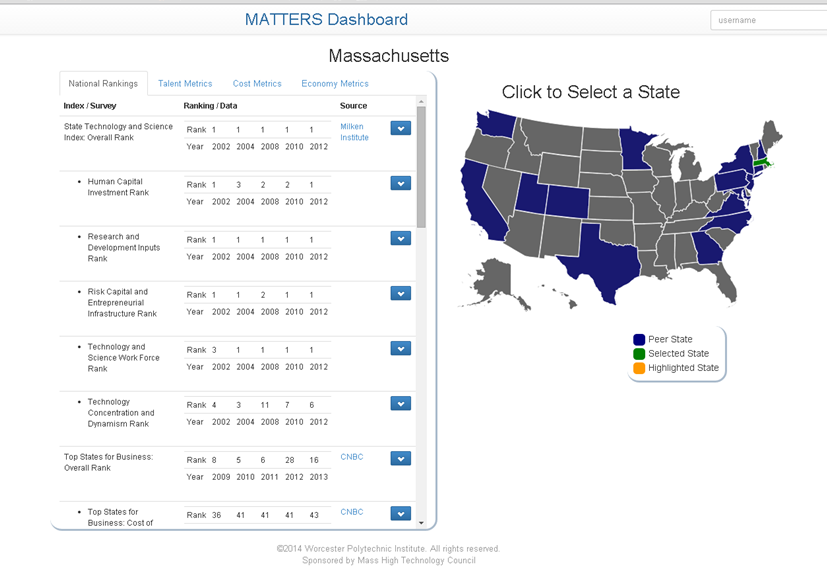
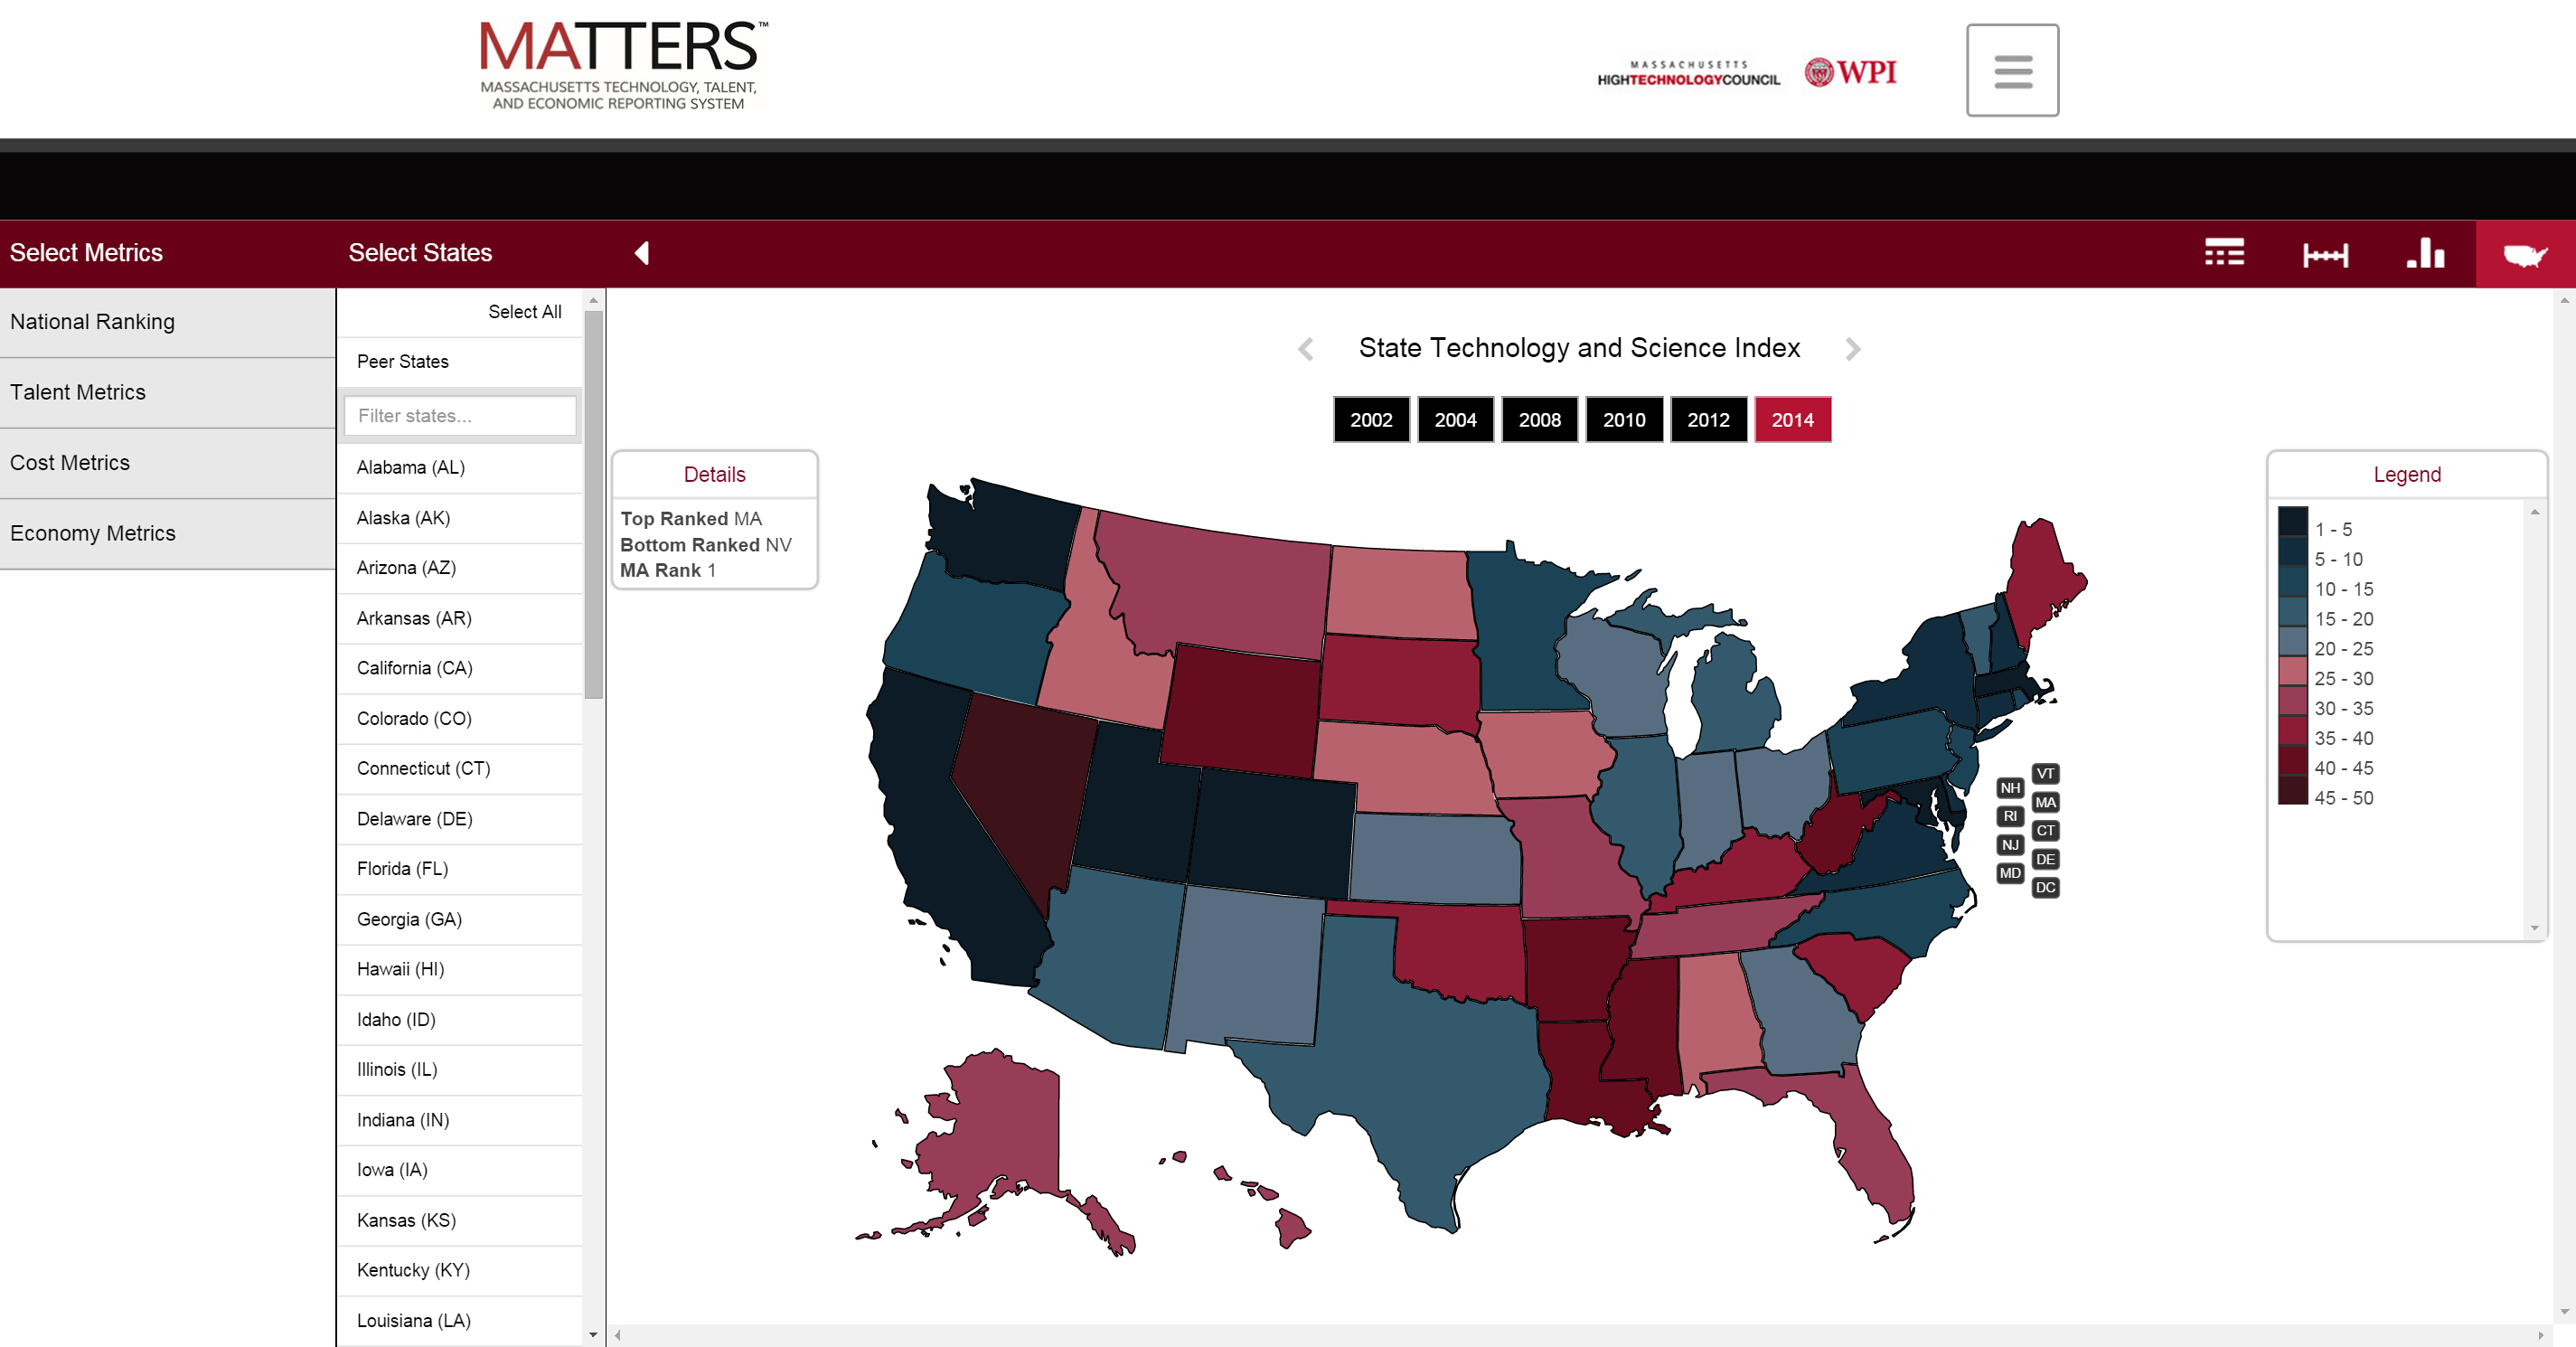
- Enhanced Data Explorer provides more description of metrics and source information. Gave more space to visualizations by changing header and enabling vertical scrolling, aided navigation through the use of pop up descriptions of site features, improved heatmap visualization through the use of more discernable colors, and added new data sets.
- Printing and Download features add utility to data displays. Users can now download excel spreadsheets of data selections and export data visualizations as images. Downloads and printouts include source information for each metric.
- Mobile site responsive design improves use of the site on mobile devices. Adapted visualizations for optimal display on 3 different screen sizes: desktop, phone and tablet.
MATTERS API
The MATTERS site contains data collected from a number of sources stored in one convenient database. To help users make the most of all of this data, a team of students developed a public facing API for data retrieval. This tool is designed to provide users access to the data points in the MATTERS database in a quick and efficient manner by making use of API calls. Developers must request an access key, and then can access these data points programmatically for their own research or other applications. Instructions for use are provided on the site, and all data is available in either JSON or excel format.
New MATTERS Analytics Feature
To measure Massachusetts competitive position and compare it to that of other states, a team of students from the Computer and Data Science departments has developed an analytics component to group states into clusters based on their similarity. Based on a user selected subset of metrics, the analytics tool displays states which are most similar to one another within the same cluster, while states in distinct clusters differ significantly from one another. Aggregate statistics are for each cluster are displayed as well.
The state grouping is achieved via a clustering algorithm that automatically estimates the similarity of states based on the selected metrics. We currently deploy the expectation–maximization (EM) algorithm, using cross validation to determine the optimal number of clusters. However, alternate clustering algorithms could be easily plugged into the MATTERS analytics framework.
Clustering of states can be performed based on different combinations of metrics, with a distinct clustering for each year. If a user selects multiple metrics, a constraint for clustering is that at least one of the selected metrics must contain values for all states. In cases where metric values are missing for few of the states, a strategy to replace missing values is used, choosing the most recent preceding value for that state. If a selected metric does not contain values for any states for a given year, it is excluded from the clustering.
The analyst can then observe how the clustering analytics display changes over time by scrolling through years. This helps the MATTERS users, such as policymakers, business leaders, and researchers, to track the trend of one or more states of interest over a number of years. The visual display indicates how states have moved closer or farther away from their peer states.
Accessed from the Home Page drop down menu, the Analytics page is consistent with the Data Explorer. Users simply select metrics they are interested in from the metric selector on the left. Metrics that are strongly correlated with other metrics and/or redundant are not available for selection. Clustering is performed on all 50 states. As metrics are chosen, the resulting clusters display to the right. An analyst can scroll over the year slider to dynamically extract the clusters for a given year.
In the display area, clusters are differentiated by color. Users can click on the legend to highlight the desired cluster and display a list of states in that cluster. The table on the right displays cluster statistics. Presently the Mean, Minimum and Maximum values of the cluster are displayed , however future additions could add additional intra-cluster and inter-cluster analysis.