|
Parallel
Coordinates

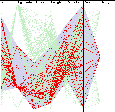
Figure 3
Parallel coordinates
is a technique pioneered in the 1970's which has been applied
to a diverse set of multidimensional problems [INS:90]. In this
method, each dimension corresponds to an axis, and the N axes
are organized as uniformly spaced vertical lines. A data
element in N-dimensional space manifests itself as a connected
set of points, one on each axis. Points lying on a common
line or plane create readily perceived structures in the image.
In generating
the display of parallel coordinates in XmdvTool, the view area
is divided into N vertical slices of equal width. At the
center of each slice an axis is drawn, along with a label at the
top end. Data points are generated as polylines across the
N axes.
Figure 3
shows an example of the Parallel Coordinates technique using the
same data set as in Figure 1. Clustering is evident among
some of the lines, indicating a degree of correlation. For
example, the X-shaped structure between the axes for cleared cases
and homicides indicates an inverse correlation, and the nearly
parallel lines betwen the axes for manufacturing workers and handgun
licenses suggests a relatively constant increase in the rate of
handgun ownership as manufacturing jobs increase (some exceptions
exist, however).
The major
limitation of the Parallel Coordinates technique is that large
data sets can cause difficulty in interpretation; as each point
generates a line, lots of points can lead to rapid clutter.
Also, relationships between adjacent dimensions are easier to
perceive than between non-adjacent dimensions. The number of dimensions
which can be visualized is fairly large, limited by the horizontal
resolution of the screen, although as the axes get closer to each
other it becomes more difficult to perceive structure or clusters.
We have extended
flat Parallel Coordinates to hierarchical Parallel Coordinates.
In hierarchical Parallel Coordinates, we represent clusters instead
of data points. The information of a cluster is visually encoded
by a variable-width opacity bands. The mean stretches across
the band and is encoded with the deepest opacity. The extend of
the band indicates the extend of the cluster. Movie 3 is a multiresolutional cluster display
of hierarchical Parallel Coordinates.
References
[INS:90]:
Inselberg, A., Dimsdale, B.. Parallel coordinates: a tool
for visualizing multidimensional geometry. Proceedings
of Visualization '90, pp. 361 - 378, 1990.
[ward:94]:
M. Ward. Xmdvtool: Integrating multiple methods for visualizing
multivariate data. Proc. of Visualization '94, p.
326-33, 1994.
|