|
|
Star
Glyphs

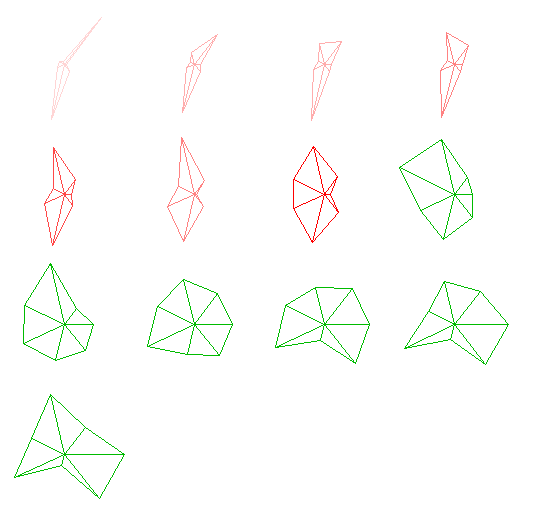
Figure 2
The definition
of a glyph covers a large number of techniques which map
data values to various geometric and color attributes of graphical
primitives or symbols [LIT:83]. Some of the many glyph representations
proposed over the years include the following:
- Faces,
where attributes such as location, shape, and size of features
such as eyes, mouth, and ears are controlled by different data
dimensions [CHERNOFF:73].
- Andrews
glyphs, which map data to functions (e.g. trigonometric) of
N variables [ANDREWS:72].
- Stars
or circle diagrams, where each glyph consists of N lines emanating
from a point at uniformly separated angles with lengths determined
by the values of each dimension, with the endpoints connected
to form a polygon [SIEGEL:72].
- Stick
figure icons, where the length, orientation, and color of N
elements of a stick figure are controlled by the dimensional
values [GRINSTEIN:89].
- Shape
coding, where each data point is represented by a rectangle
which has been decomposed into N cells and the dimensional value
controls the color of each cell [BED:90].
In XmdvTool, we use the star glyph pattern [SIEGEL:72]. The user
can choose between either uniformly spaced glyphs or using two
of the dimensions to determine the location of the glyph within
the window. Each ray of the glyph has a minimum and maximum
length, determined either by the user (for glyphs with data-driven
locations) or by the size of the view area (for uniformly spaced
glyphs). A key for interpreting the dimensions is included
in a separate window.
Figure 2 shows
an example of glyphs in XmdvTool using the same data set as in
Figure 1. The evolution of the shape over time indicates
both trends and anomalies. For example, the clear protrusion
in the direction associated with cleared homicides (257 degrees)
found in the earlier shapes evolves into a concavity over time.
Glyph techniques
are generally limited in the number of data elements which can
be displayed simultaneously, as each may require a significant
amount of screen space to be viewed. The density and size
constraints of the elements, however, depend on the level of perceptual
accuracy required. Also, it can be difficult to compare
glyphs which are separated in space, although if data dimensions
are not being used to determine glyph locations, the glyphs can
be sorted or interactively clustered on the screen to help highlight
similarities and differences. Most of the glyph techniques
are fairly flexible as to the number of dimensions which can be
handled, though discriminability may be affected for large values
of N (greater than 20 or so).
We have extended
flat star glyphs to hierarchical star glyphs. In flat star glyphs,
a star glyph presents a data item. While in hierarchical star
glyphs, a star glyph presents the mean of a cluster. The colorful
band around it indicates the extend of the cluster. Movie
2 is a multiresolutional cluster display of hierarchical star
glyphs.
References
[ANDREWS:72]:
Andrews, D.F.. Plots of high dimensional data. Biometrics,
Vol. 28, pp. 125-136, 1972.
[CHERNOFF:73]:
Chernoff, H.. The use of faces to represent points in k-dimensional
space graphically. Journal of the American Statistical
Association, Vol. 68, pp. 361-368, 1973.
[GRINSTEIN:89]:
Grinstein, G., Pickett, R., Williams, M.G. . EXVIS: an exploratory
visualization environment.
Graphics Interface '89, 1989.
[LIT:83]:
Littlefield, R.J.. Using the GLYPH concept to create user-definable
display formats. Proc. NCGA '83, pp. 697-706, 1983.
[SIEGEL:72]:
Siegel, J.H., Farrell, E.J., Goldwyn, R.M., Friedman, H.P..
The surgical implication of physiologic patterns in myocardial
infarction shock. Surgery, Vol. 72, pp. 126-141,
1972.
[WARD:94]:
M. Ward. Xmdvtool: Integrating multiple methods for visualizing
multivariate data. Proc. of Visualization '94, p.
326-33, 1994.
|